All about scATAC-seq's quality control
One main challenge in scATAC-seq analysis is to distinguish the good cells (high quality cells), the bad cells(low quality cells), and the ugly cells (doublet cells).
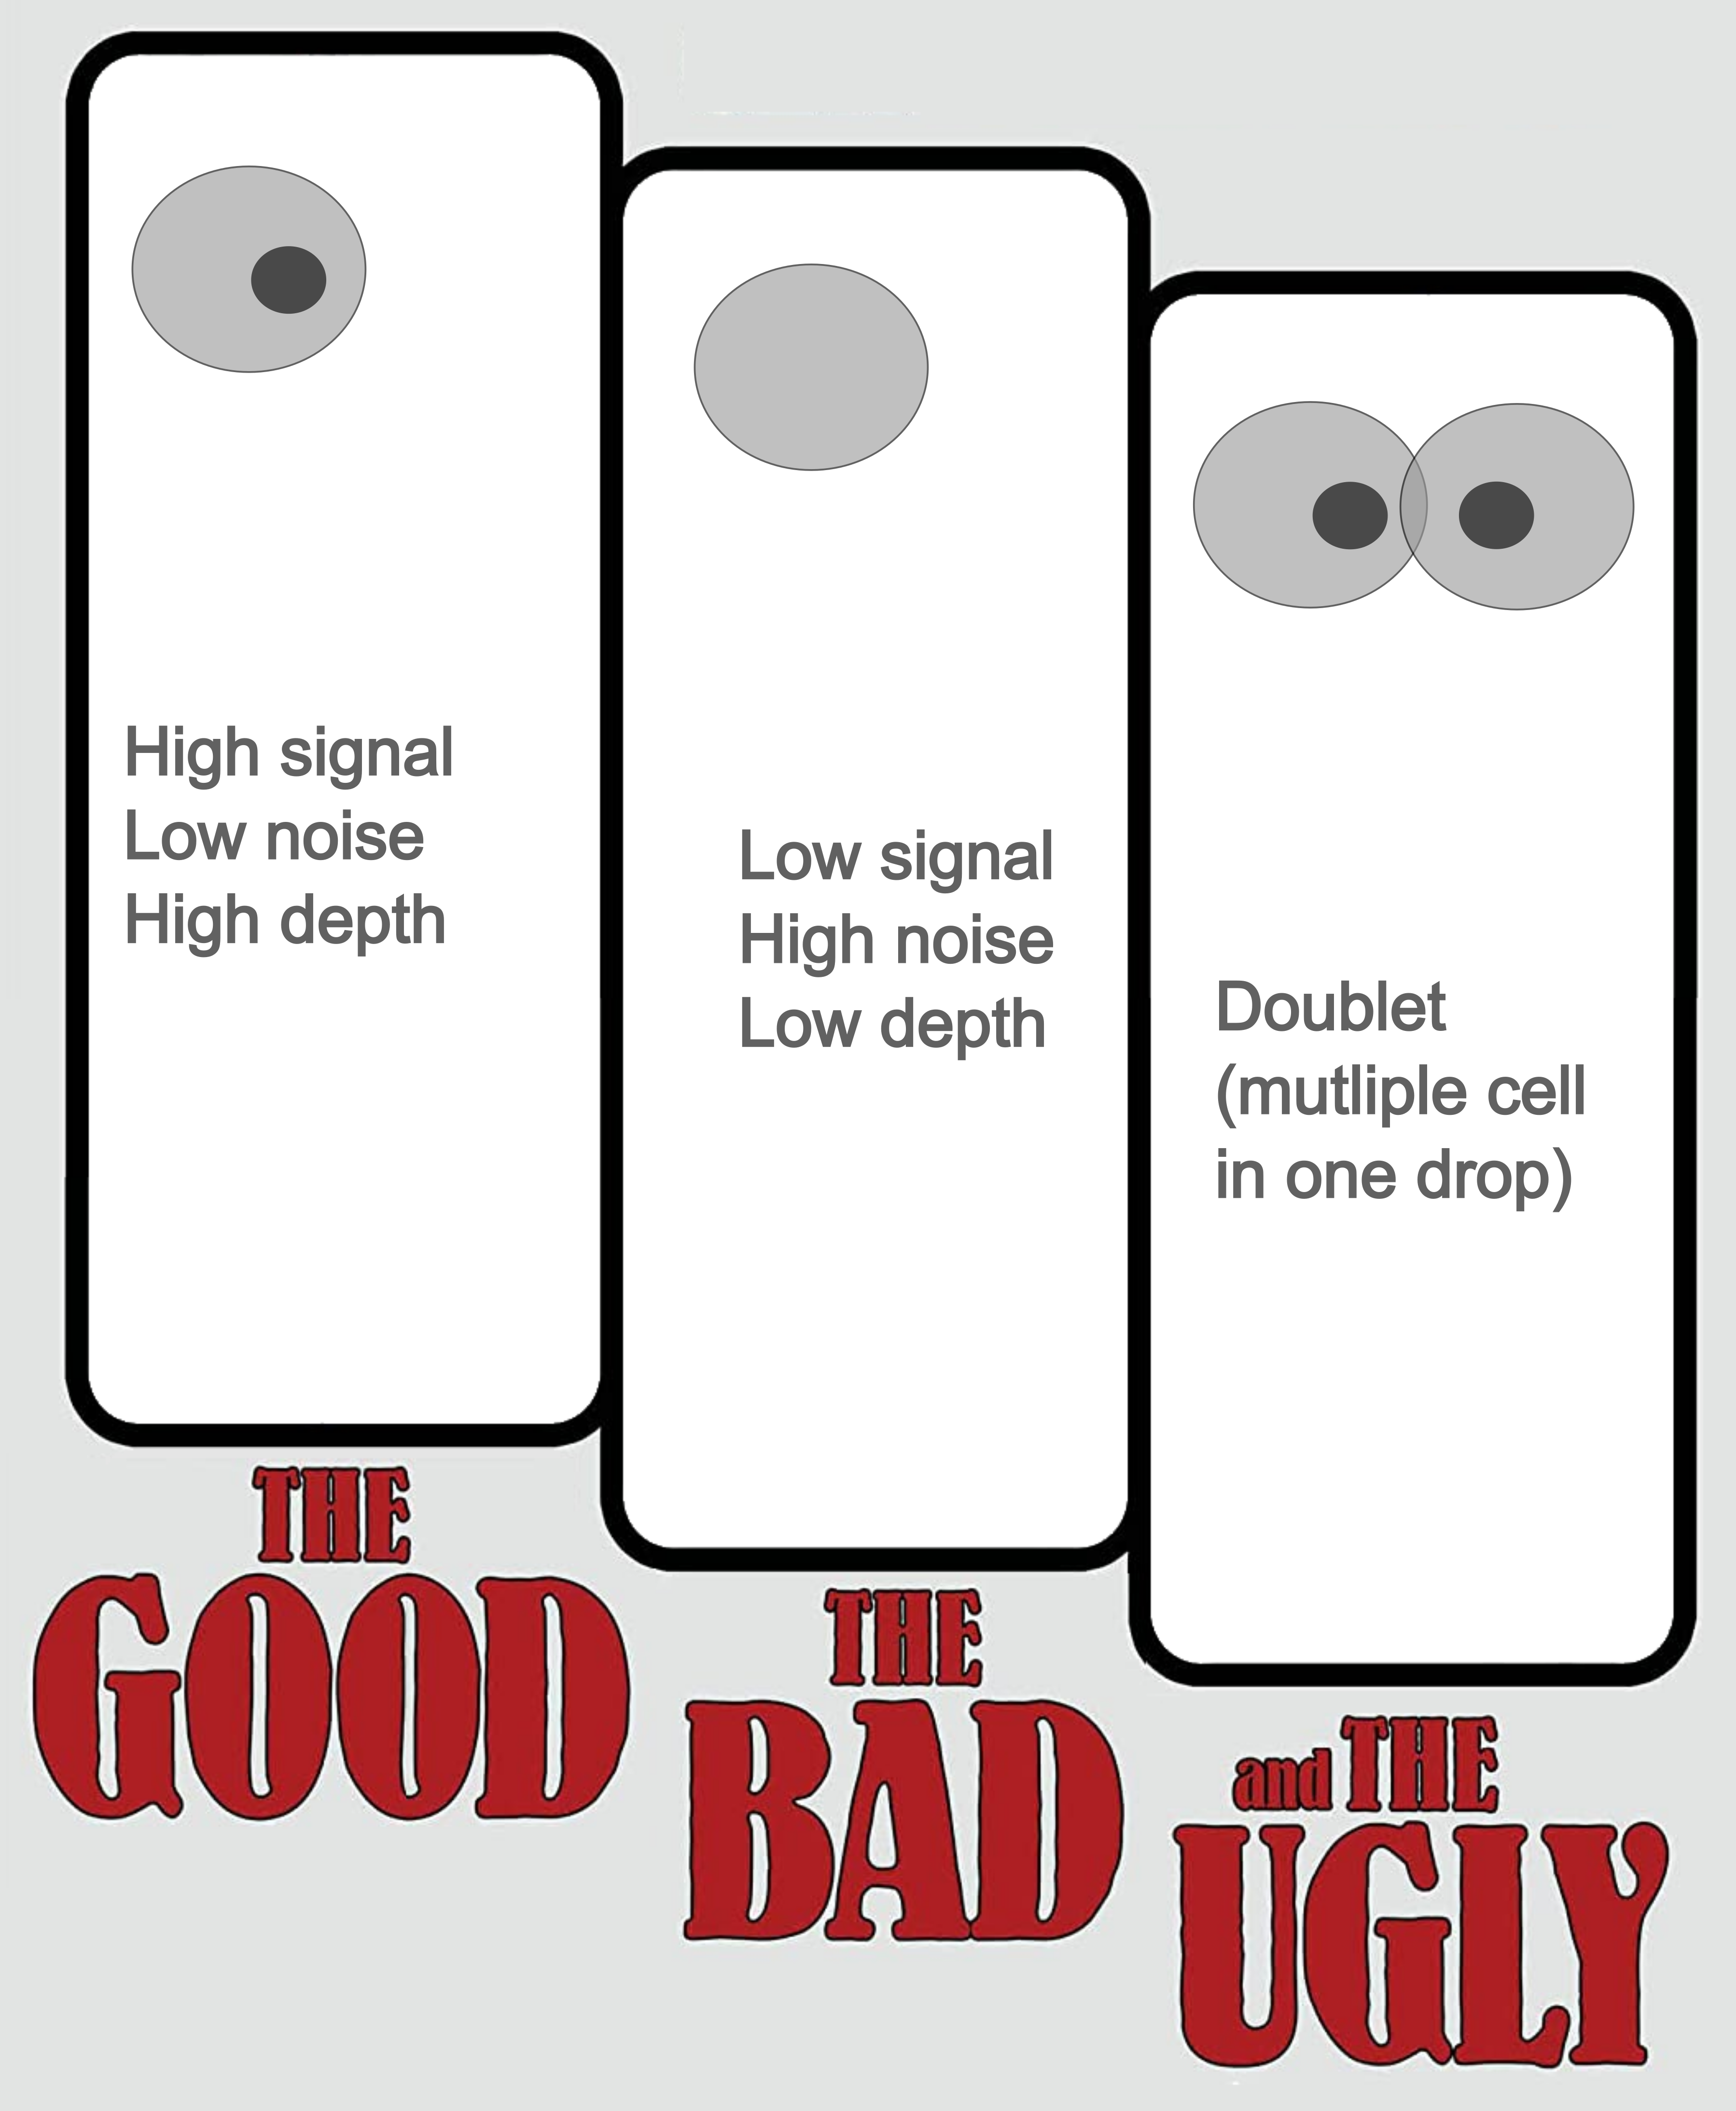
The bad—- low quality cell
Why should I perform quality control
The low quality cells and the doublet cells can influence the downstream analysis, such as clustering (form a unique cluster), trajectory analysis (create artificial trajectories) and so on. OSCA book has great explaination about this issue.
What metrics are used to distinguish between the good and the bad
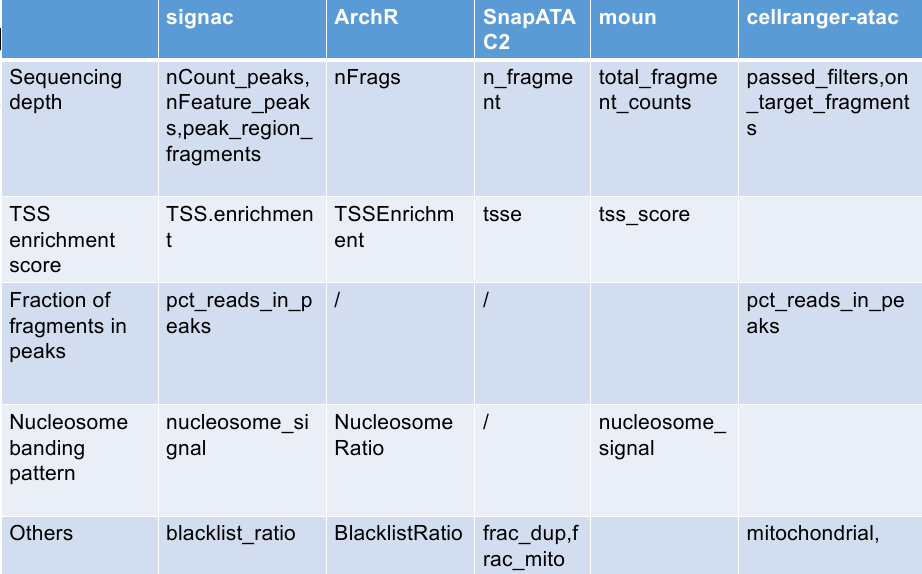
Different frameworks perfer different metrics to perform quality control. For example, ArchR and SnapATAC2 utilized TSS enrichment and number of unique fragments. And Muon use TSS enrichment and nucleosome signal to perform quality control. To compare what’s best strategy to preform quality control, I firstly classified the metrics to following categories.
Sequencing depth
Similar with scRNAseq datasets, scATAC has sequencing depth, which related with total number of fragments in peaks, unique fragment number, unique peak number, and so on. Low sequencing depth means low quailty. High sequencing depth may related with doublets, nuclei clumps, or other artefacts.
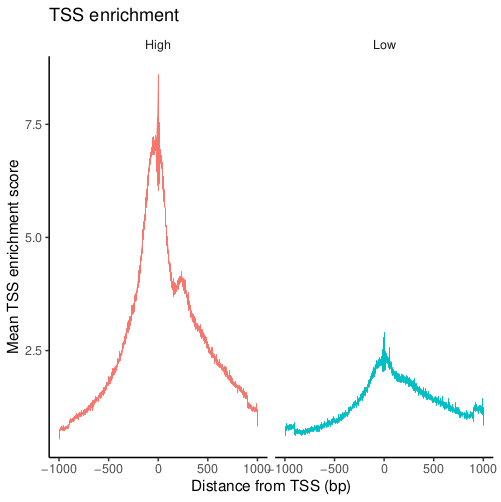
Transcriptional start site (TSS) enrichment score
TSS enrichment score is the ratio of fragments centered at the TSS to fragments in TSS-flanking regions. This metrics is used in nearly every scATAC framework. Extremely high TSS scores and extremely low TSS scores are both not good signs.
Fraction of fragments in peaks (FRiP)
Represents the fraction of all fragments that fall within ATAC-seq peaks. This is a good metric to show signal-noise ratio.
Nucleosome banding pattern
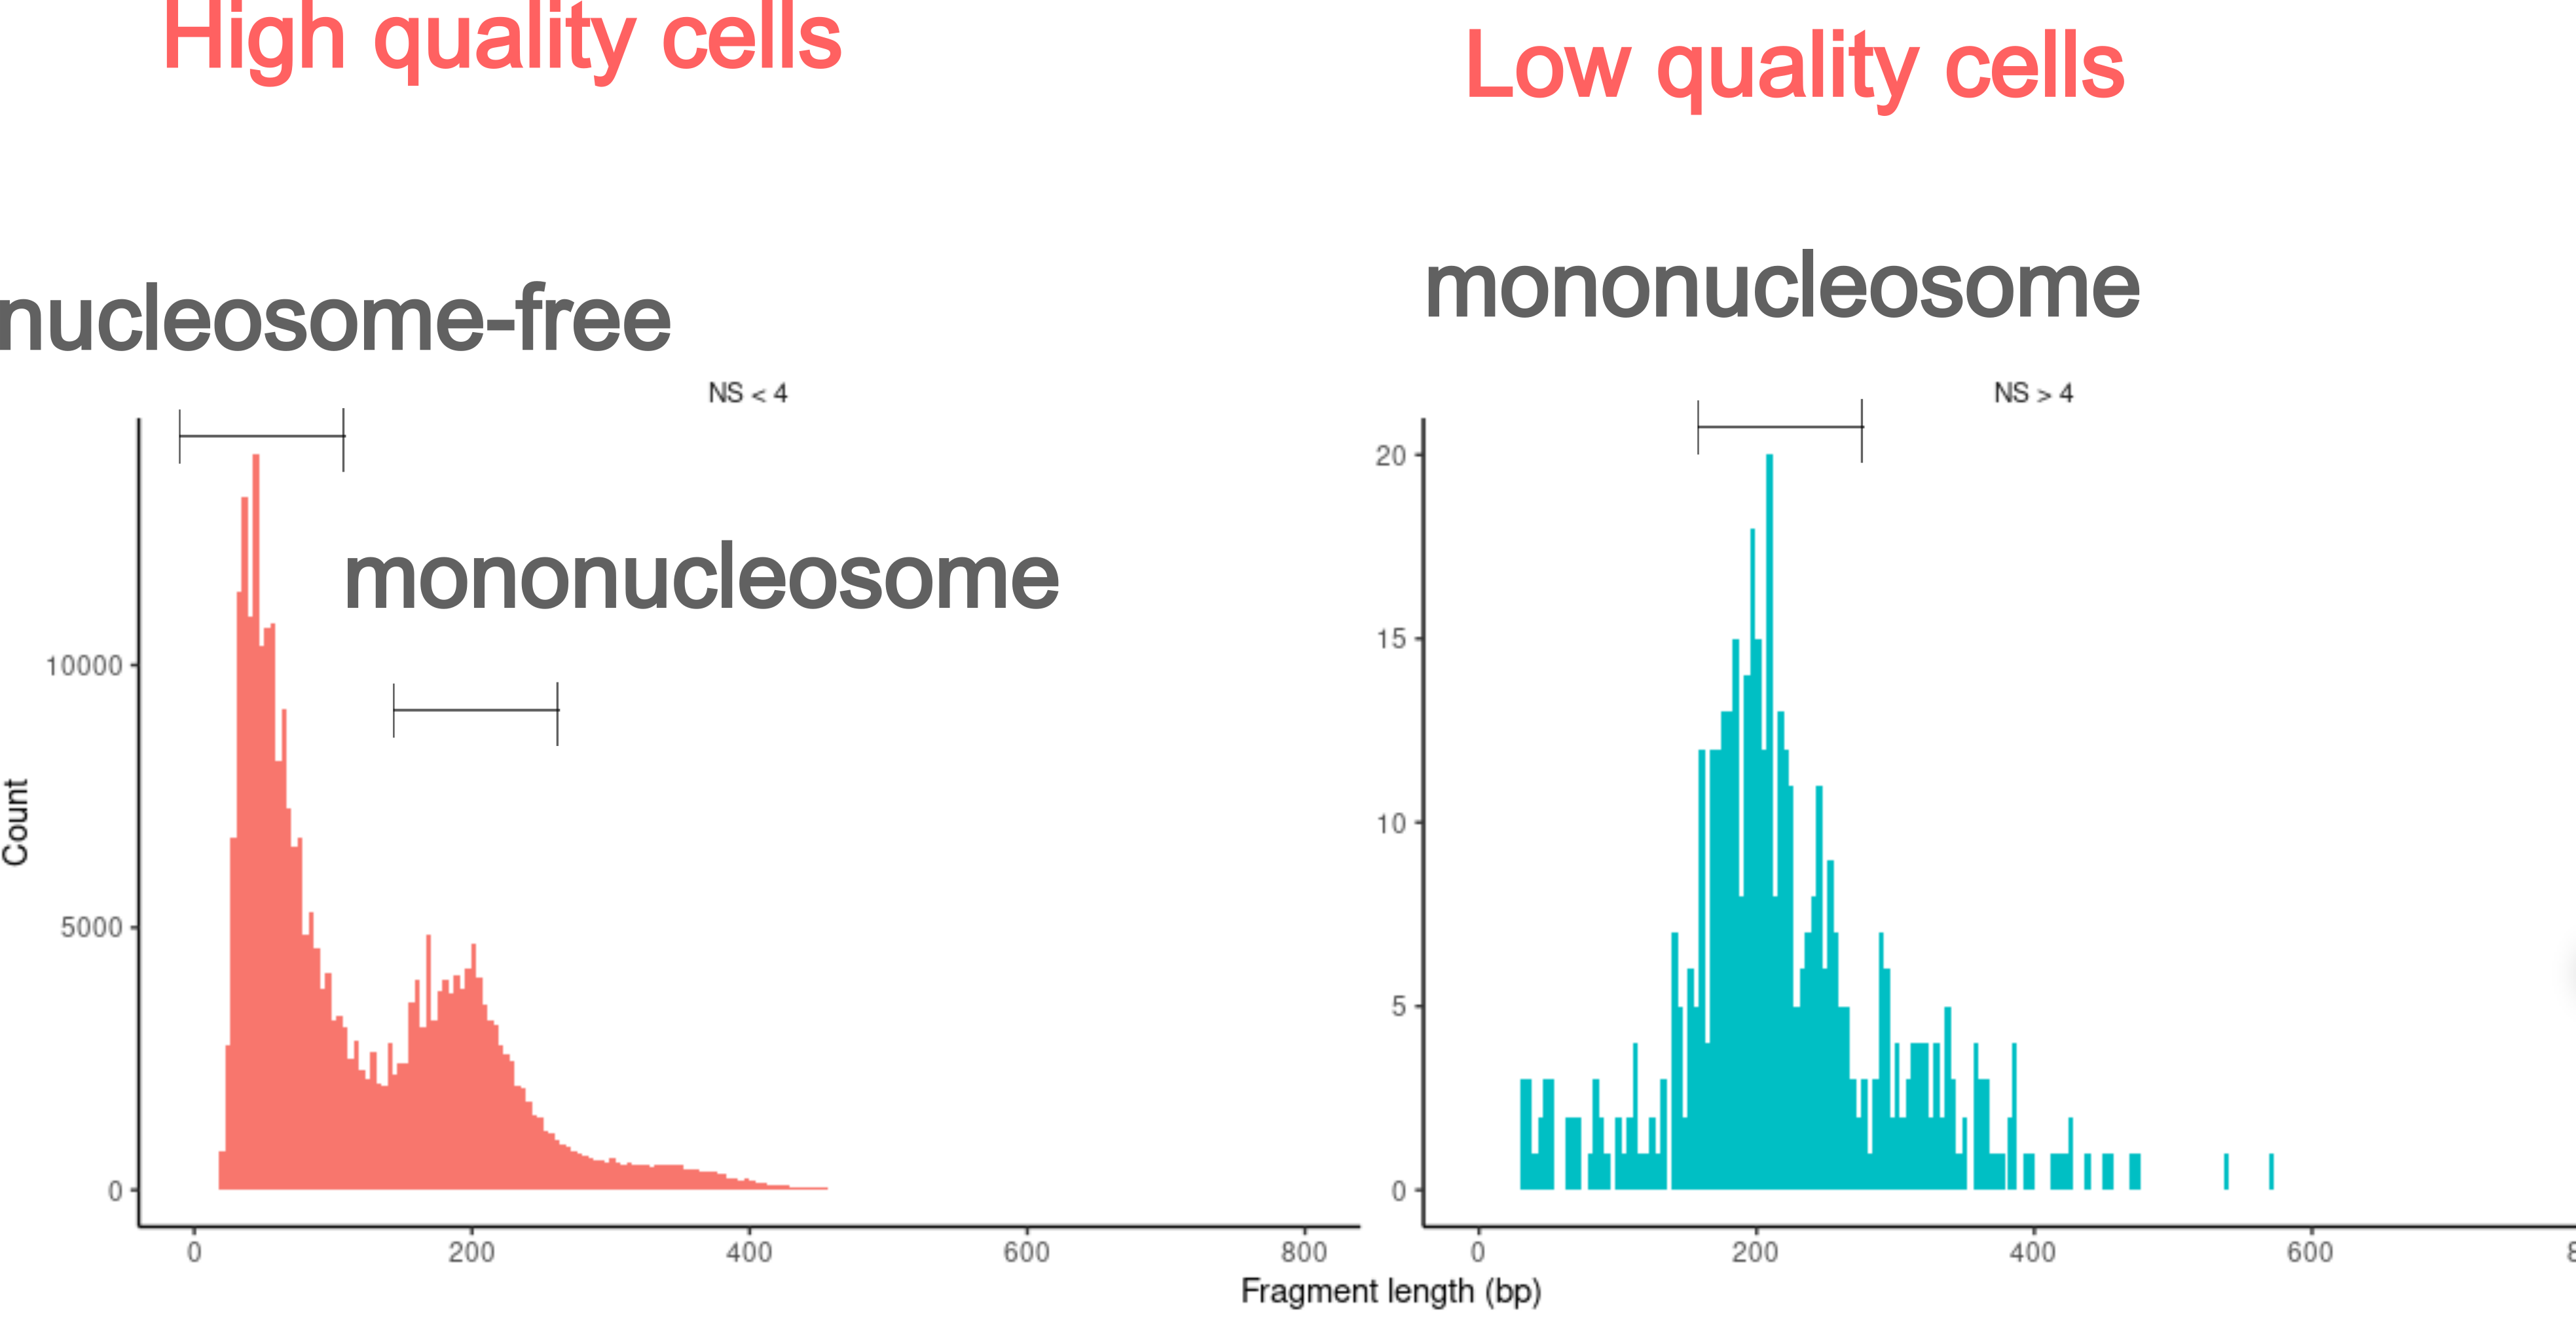
Because chromosomes are organized into units called nucleosomes, fragment size can exhibit periodic distribution correlated with nucleosome size. Fragments in high quality cells are nucleosome-free (<147 bp).
Others
For example, duplication fraction in pycistopic, ratio reads in genomic blacklist regions in signac.
How to choose quality control metrics?
A good metric typically effectively distinguishes between good and bad cells. So, we begin by exploring whether the above metrics are indicative.
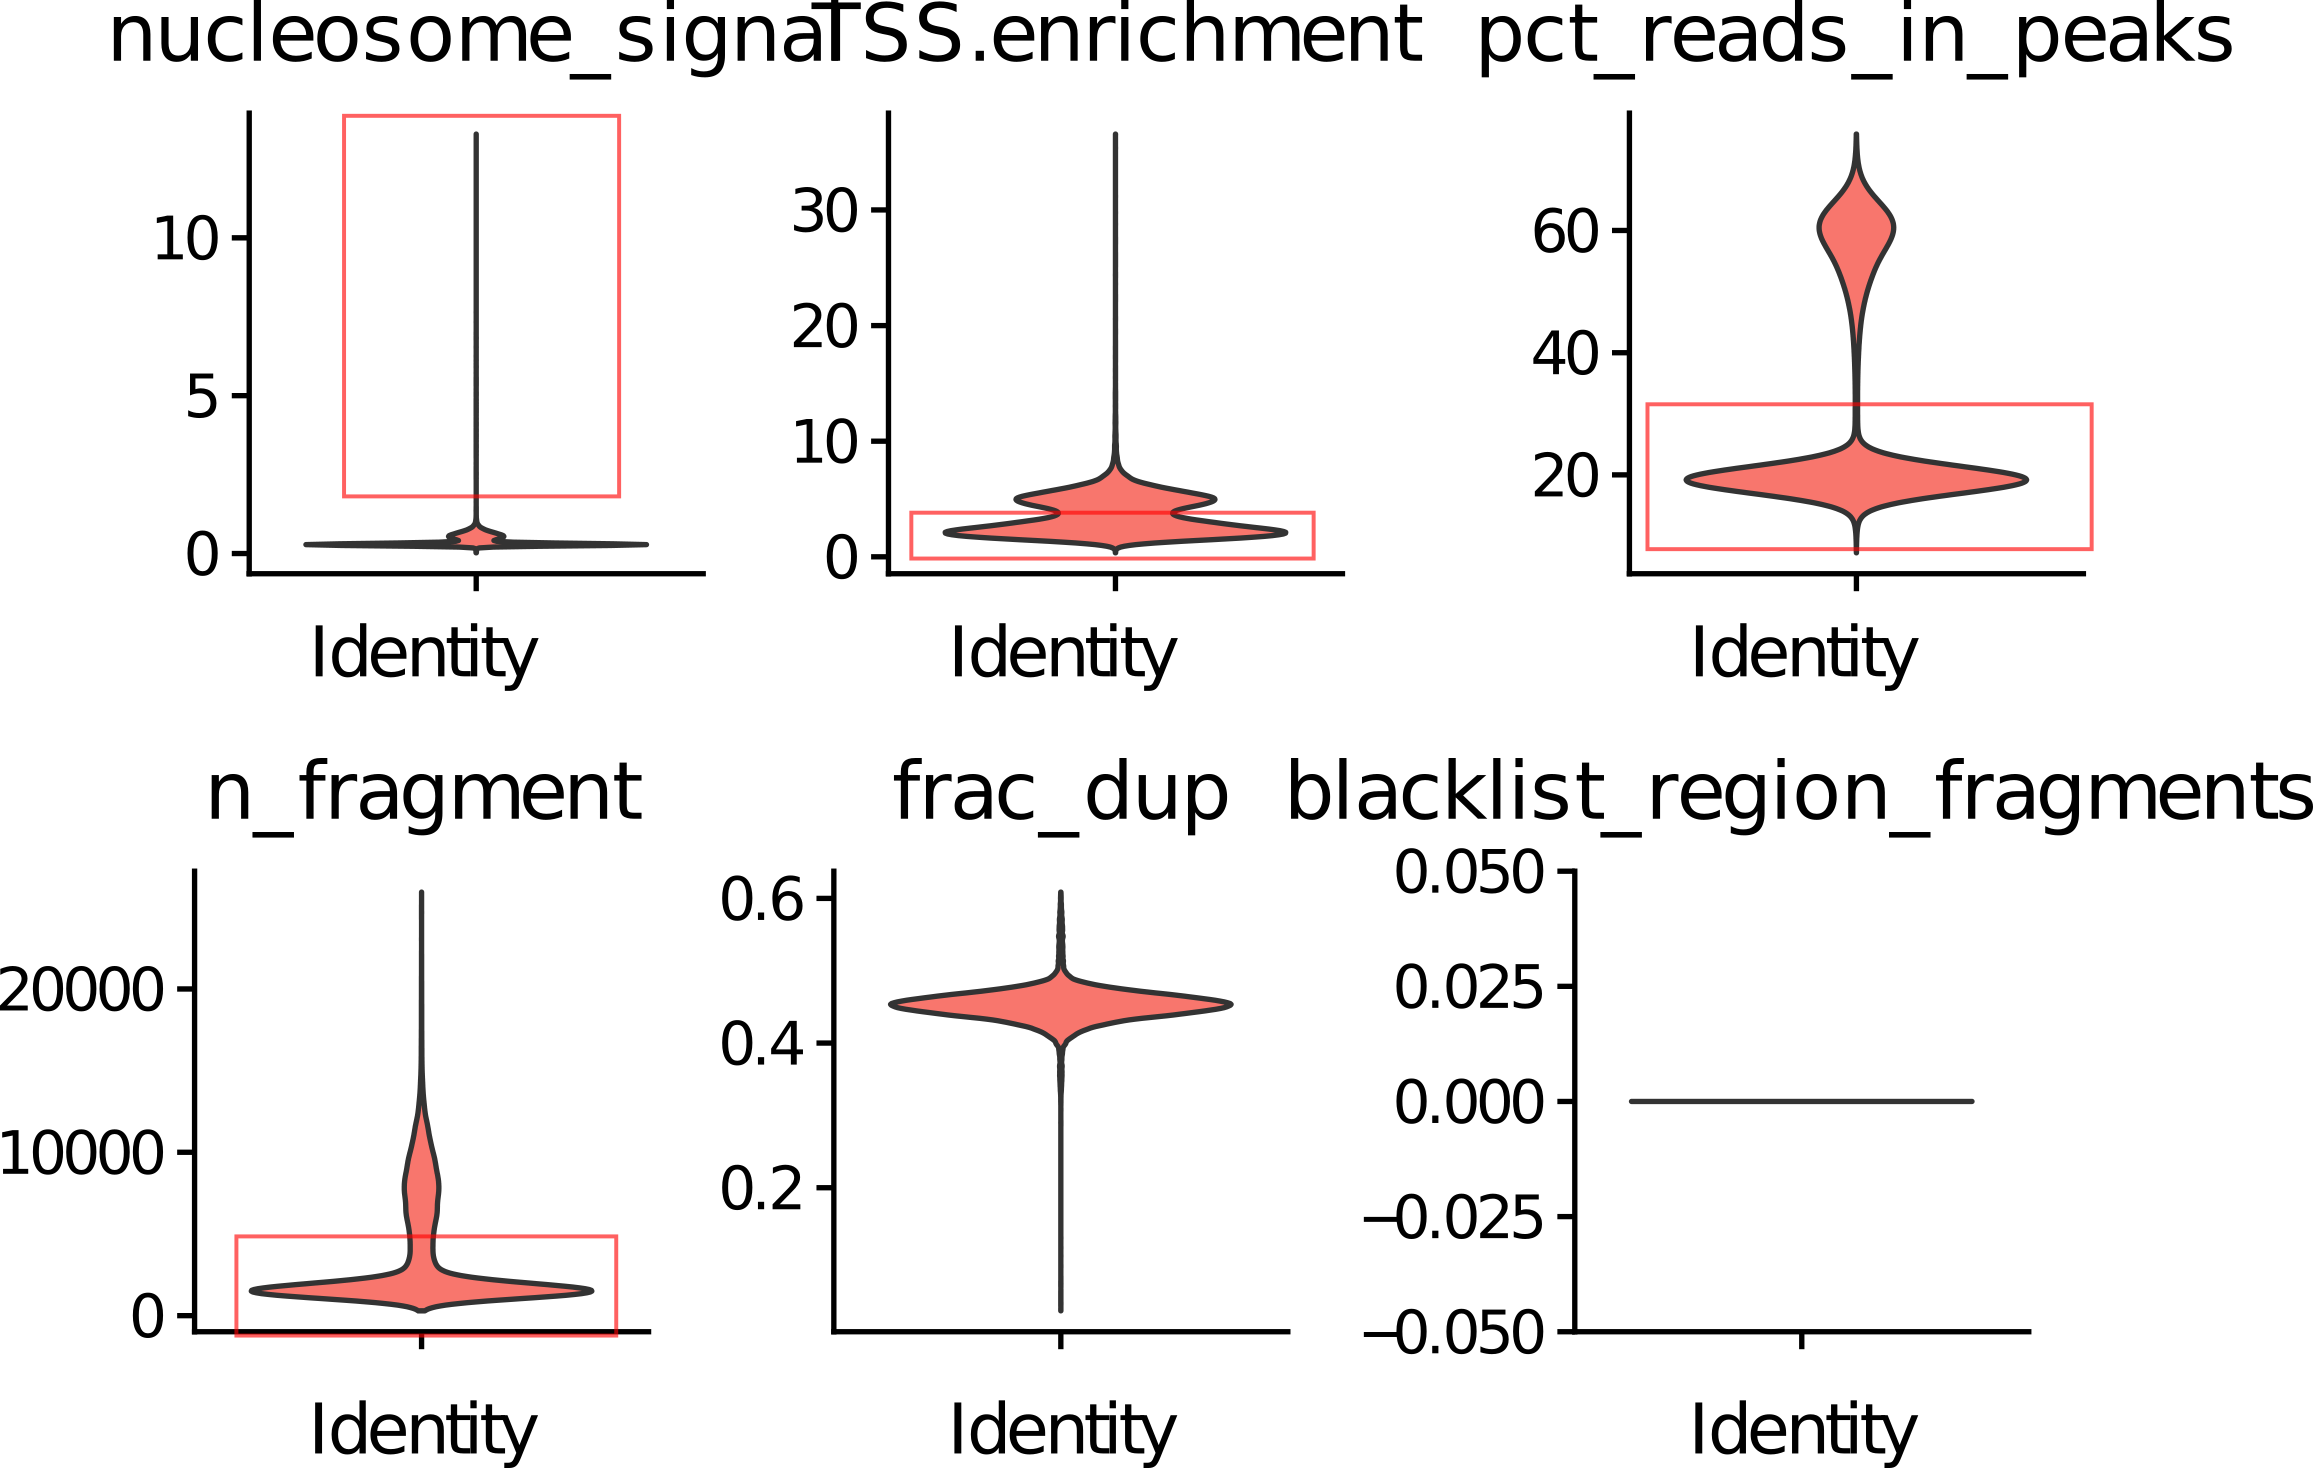
We observed that the four metrics seperate bad cells (red box) and good cells well. If we combine these metrics, the seperation are more clear.

How to filter cells base on QC metrics
While low quailty cells can be discovered with different reasons (i.e. low sequencing depth, high nucleosome signal), we noticed that high quality cells are usually clustered together. This give us a intuation, that we can select cells base on unspervise clustering methods, like Kmeans.
Base on this thought, I apply kmeans on QC metrics to assess wether it can select high quality cells.
I select TSS enrichment, nucleosome signal, percent of reads in peaks, number of fragment to be the feature. After normalization, I apply Kmeans.

As we can see, Kmeans method is excellent at select high quality cells. Low quality cells are grouped together to form low-sequencing-depth cluster, high-nuleosome-signal cluster, and low-TSS score clusters.
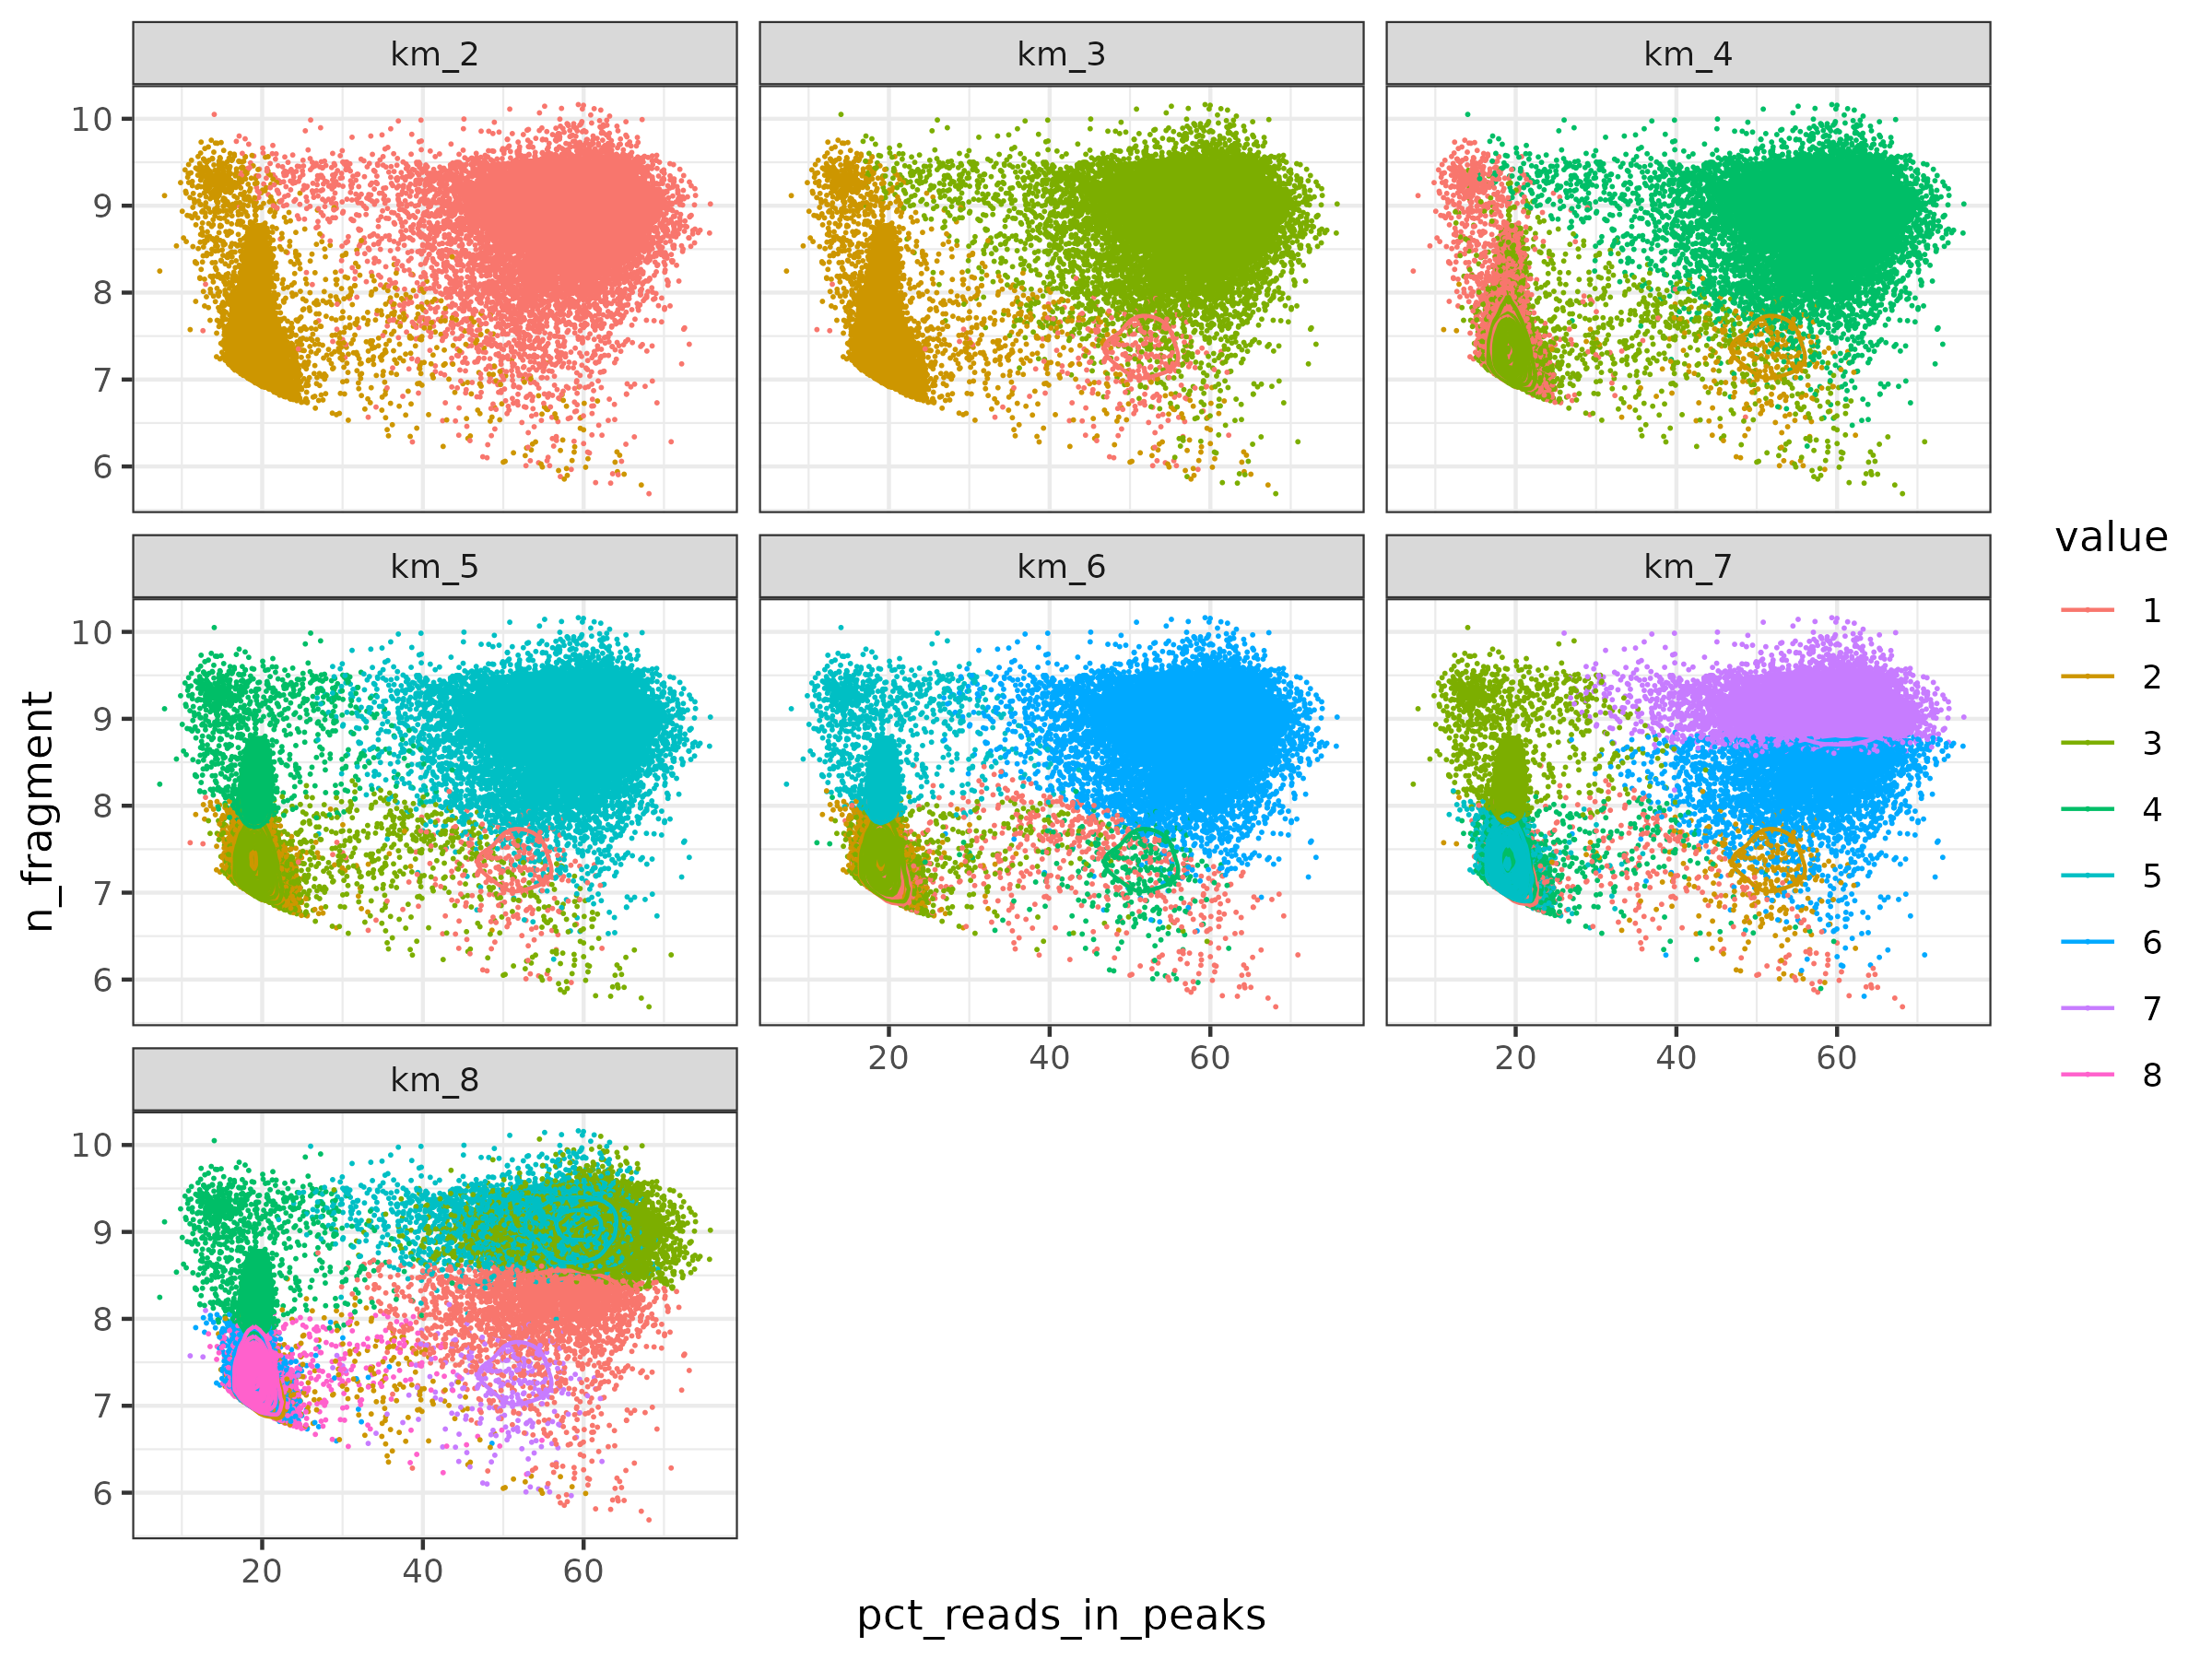
I tried different number of clusters in Kmeans. As we can see, this methods is very robust, high quality cells are always cluster togehter until cluster number increase to 6.
What about other QC methods
I compared different QC methods provided by various framework. The results are show below.
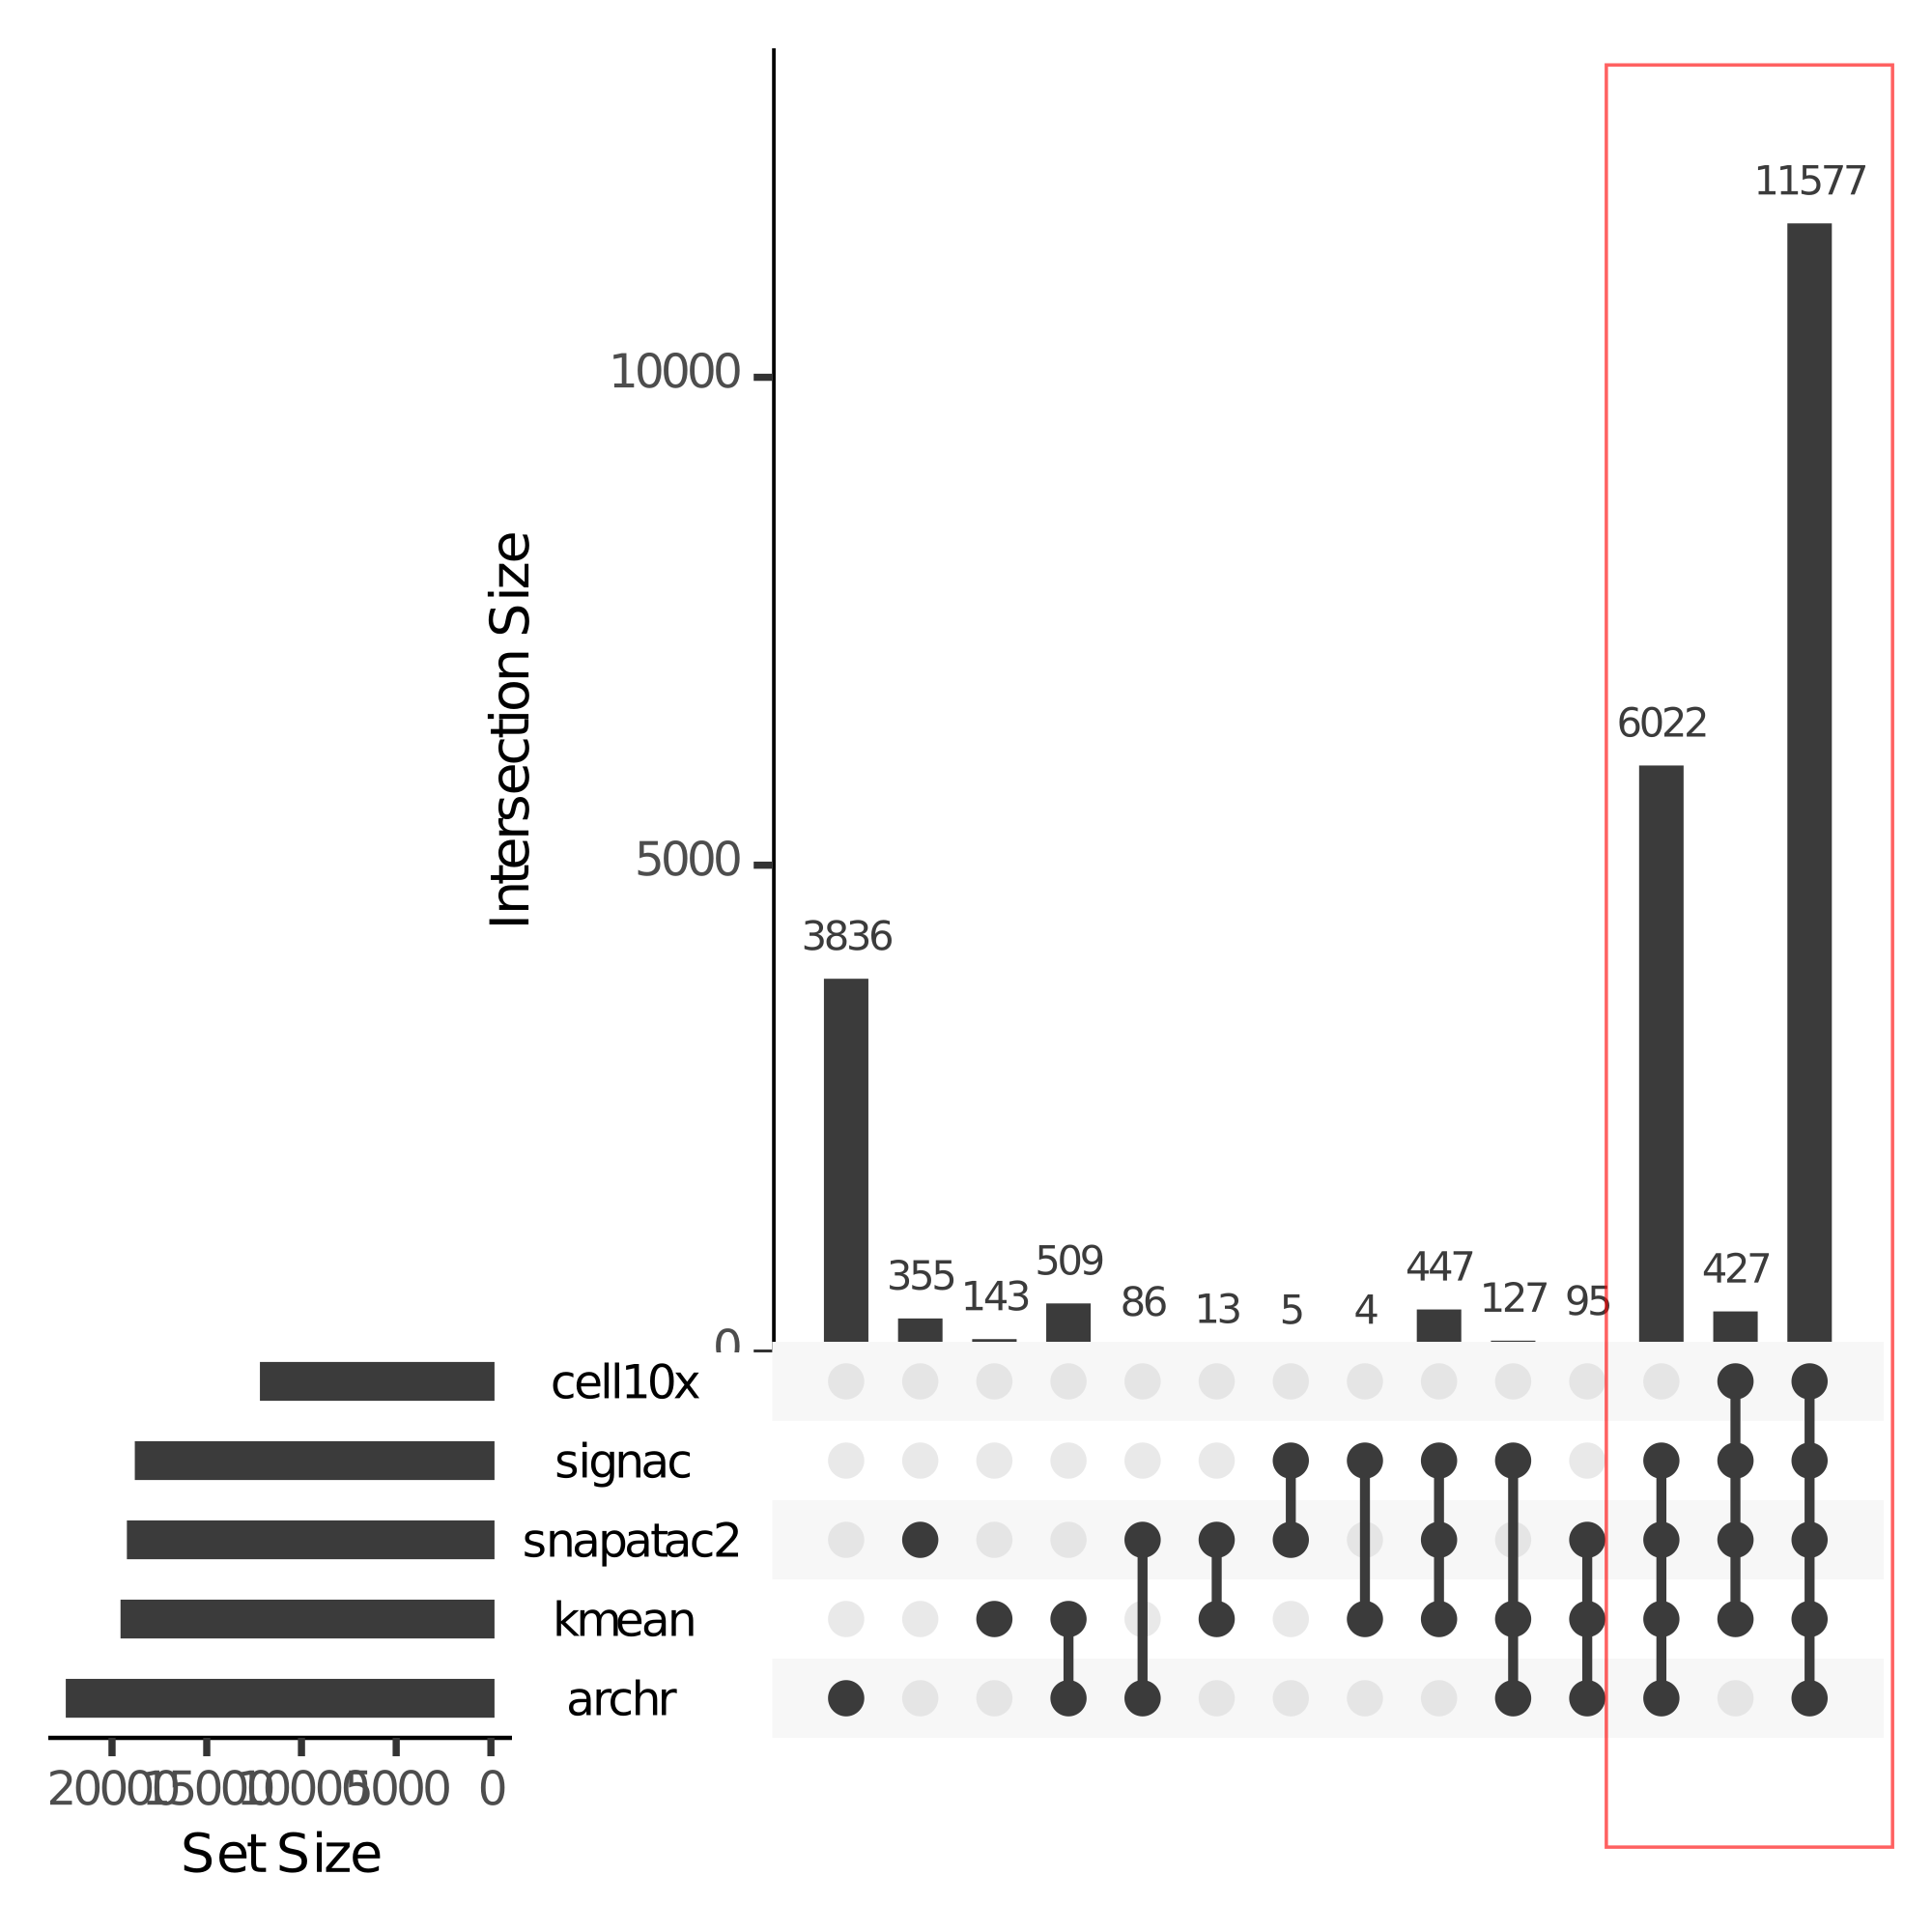
Not suprising, the results in different methods are similar. But what’s the best quality control methods? I used total cell number - unique cell number to roughly estimate the performance of different methods.
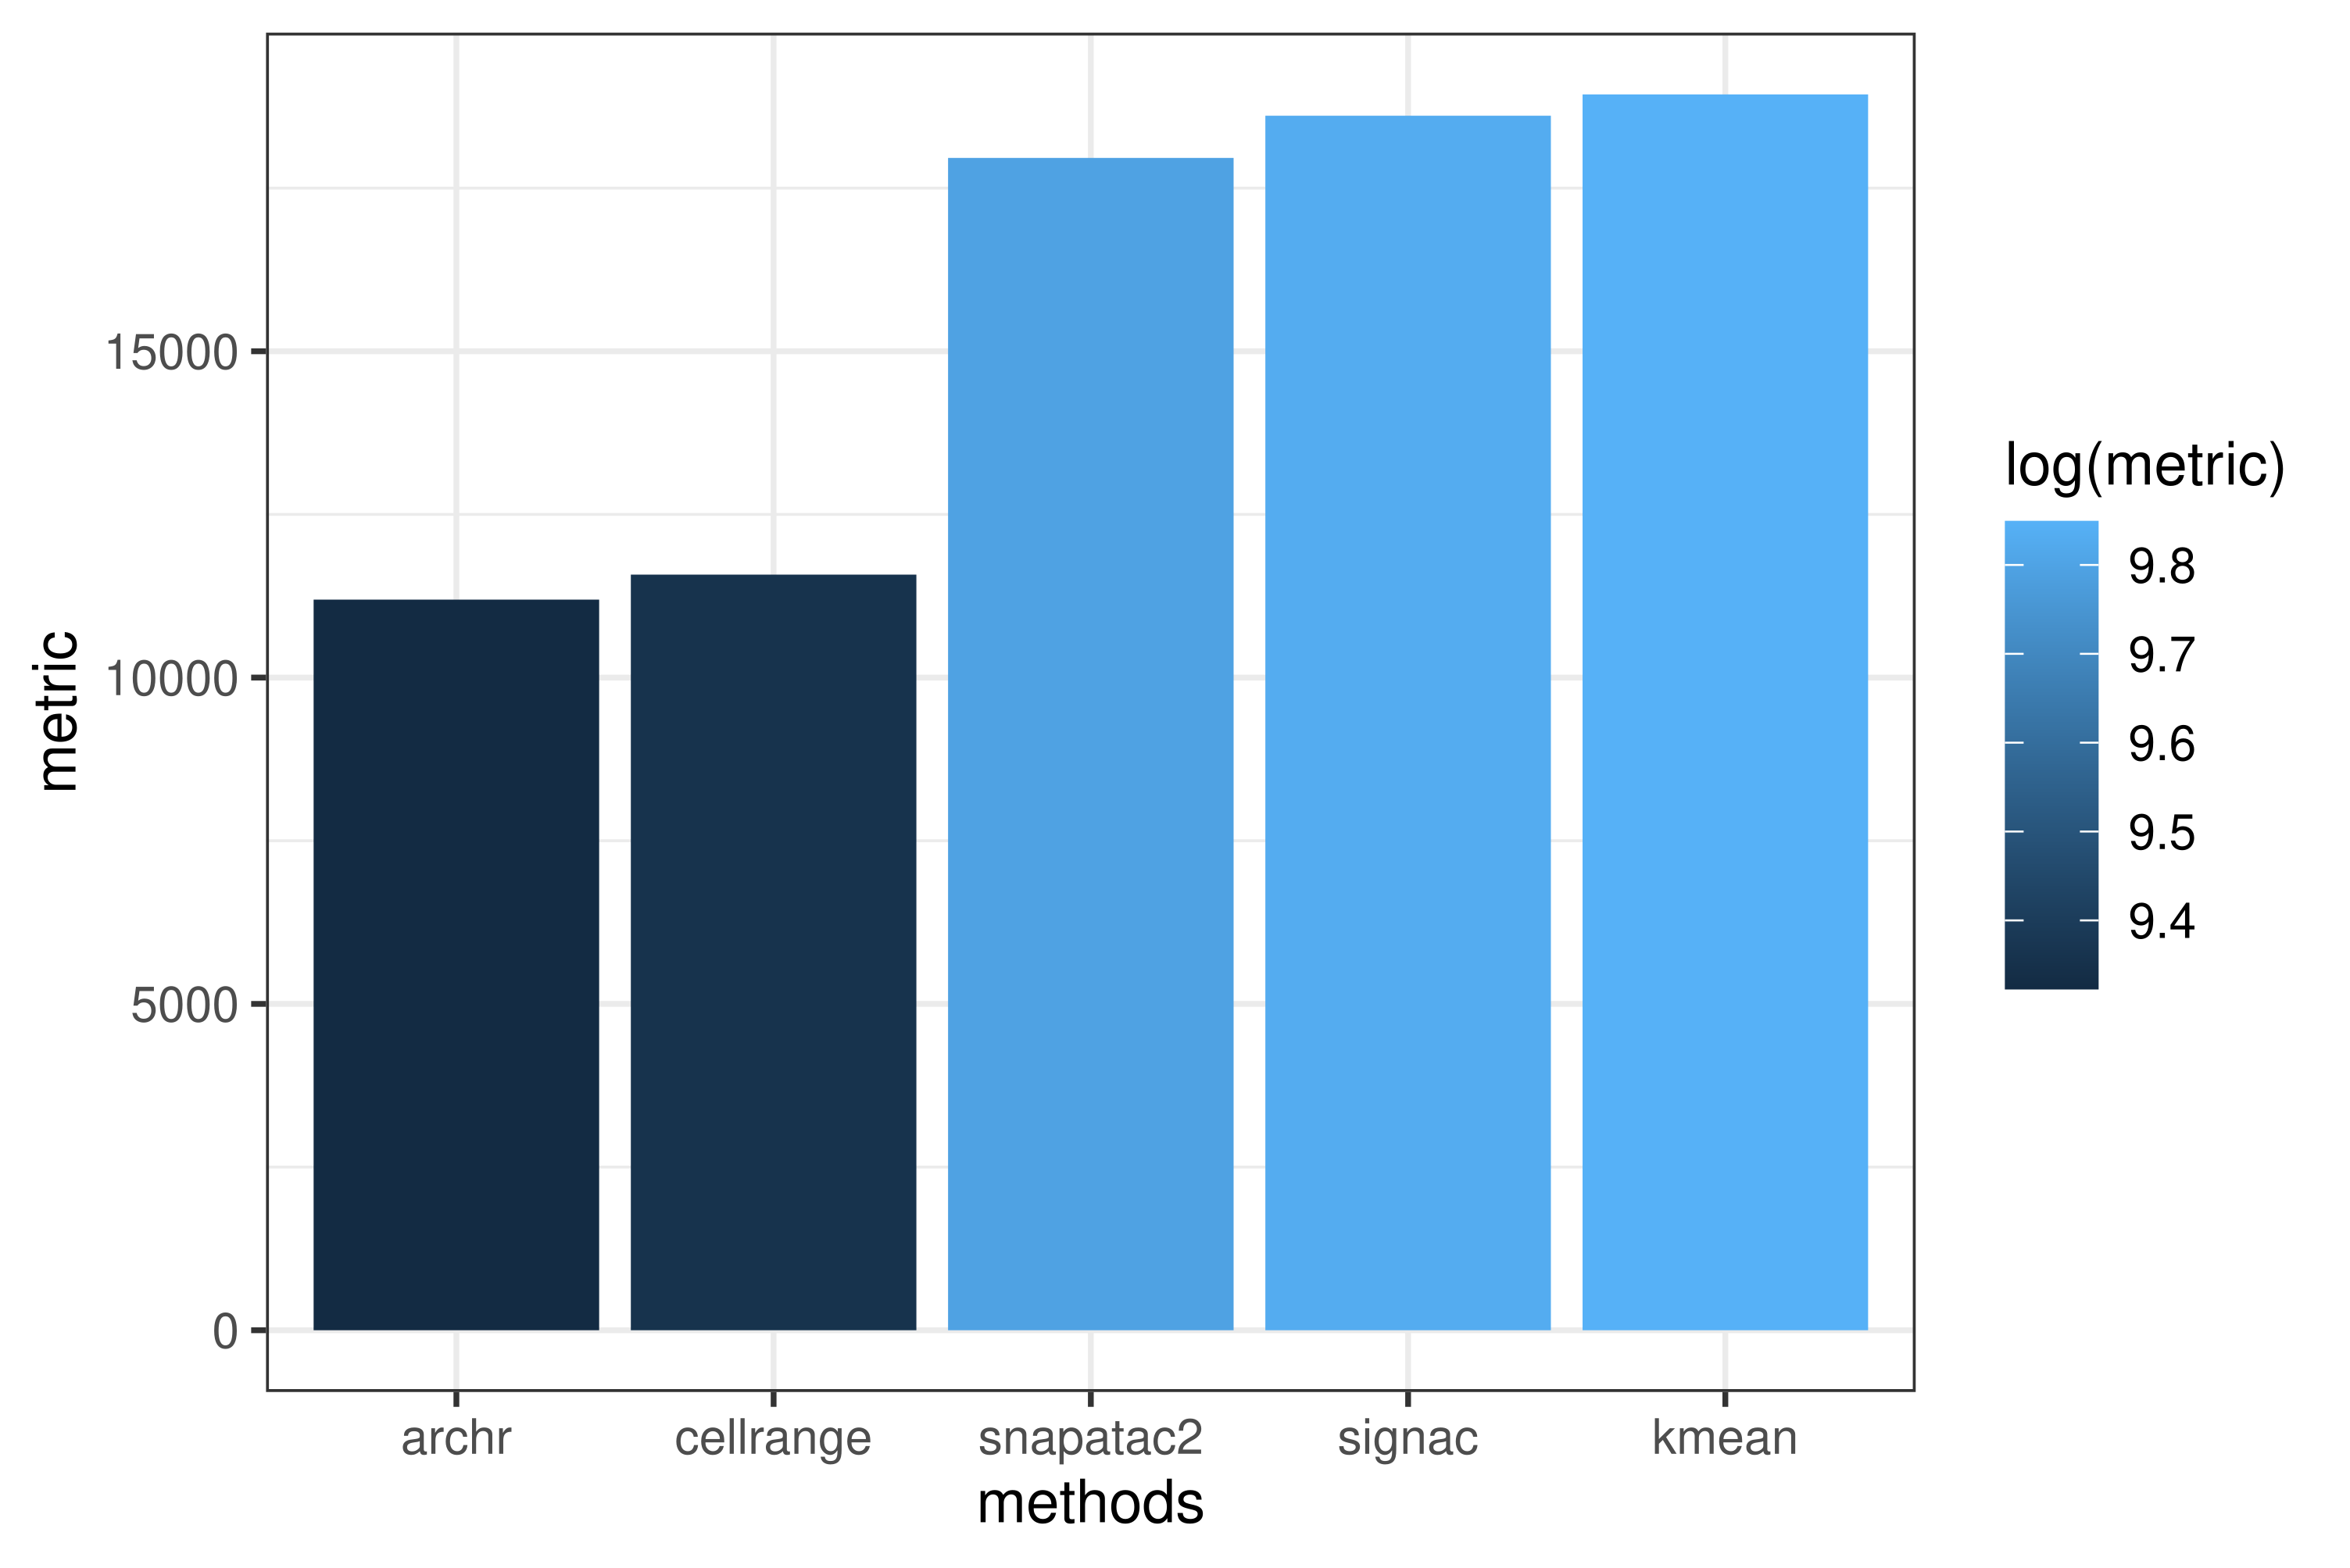
As we can see, Kmeans methods has best performance in our datasets.
What’s filter methods of cellrangers?
You may notice that cellranger’s quality control is very strict. While other methods leaves 18000-20000 cells, cellranger’s qc only leaves 11577 cells. You can find the filter results in filtered_peak_bc_matrix.h5 and singlecell.csv. From their pipeline, we can see it remove doublet and low quality cells with it’s own methods.
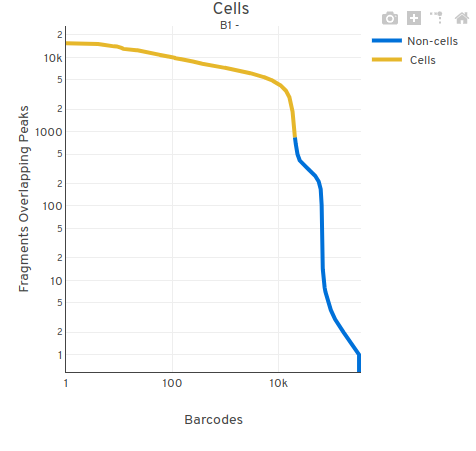
It use cell-calling heuristic to filter low sequencing depth cells. Due to its overly stringent filtering outcomes, I don’t believe that using cellranger’s filtering results from the outset is a good idea.
Should I use strict QC threshold or loose QC threshold?
I suggest to use loose method at first. The worst outcome with a loose QC threshold is an arificial cluster/trajectory. Usually you can find them at downstream. However, if you begin with strict QC at first, you may never know what opportunities you’ve missed in terms of discoveries.
The ugly —– doublets
Common strategy to find doublets
There are two strategies to detect doublets. One approch is based on simulation, the other is based on coverage. Here describe the difference between the two methods.
What’s the best way to detect doublets
As suggested by author of scDblFinder, it’s better to combine the two methods (coverage-based and simulation-based) to discover doublets. As most frameworks’ doublets detection methods are simulation-based, I compared the results run by scDblFinder, ArchR (demuxlet), and SnapATAC2 (scrublet). The more related with amulet (coverage-based method), the results are better.
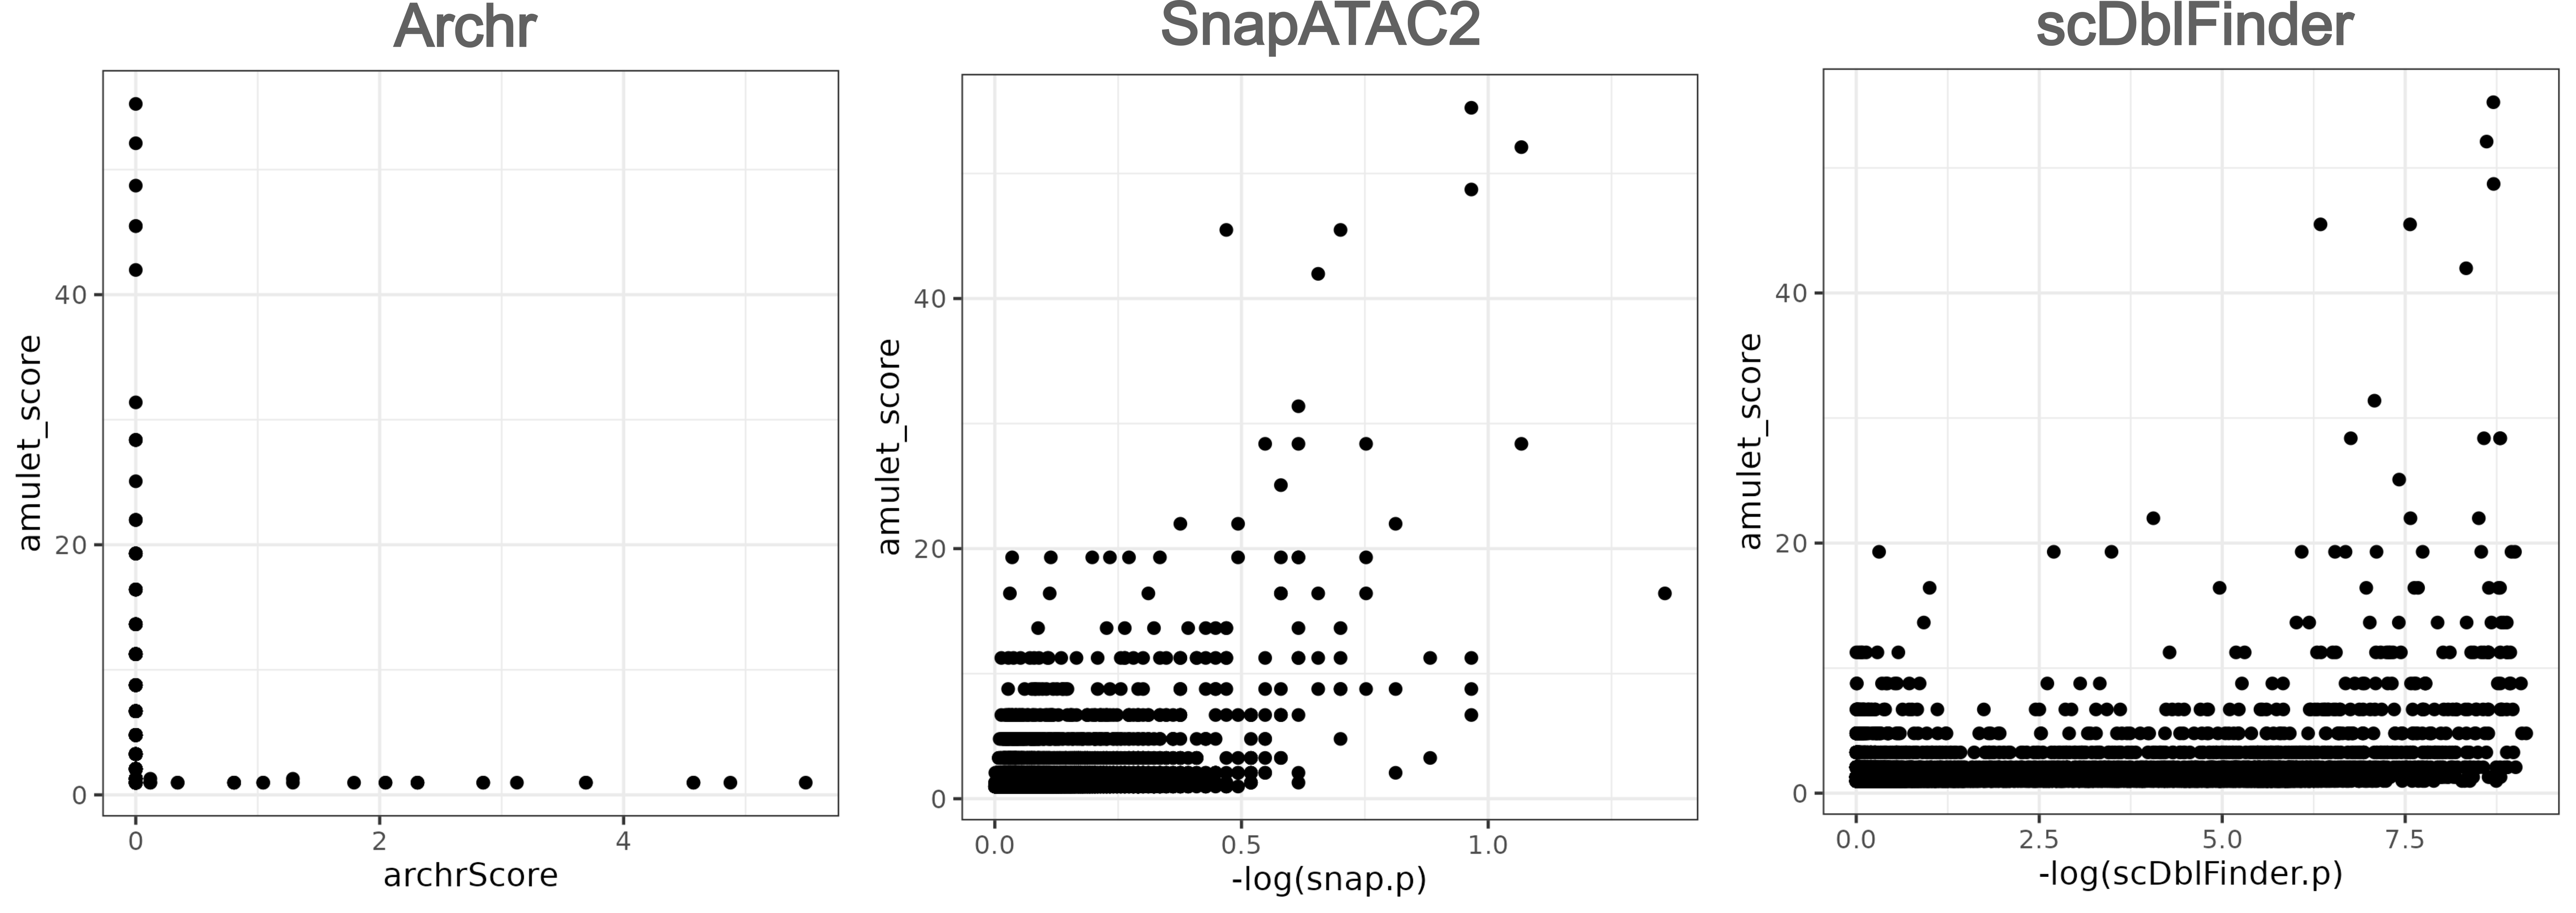
As we can see, except ArchR showed bad performance, SnapATAC2 and scDblFinder both exhibit good performance.
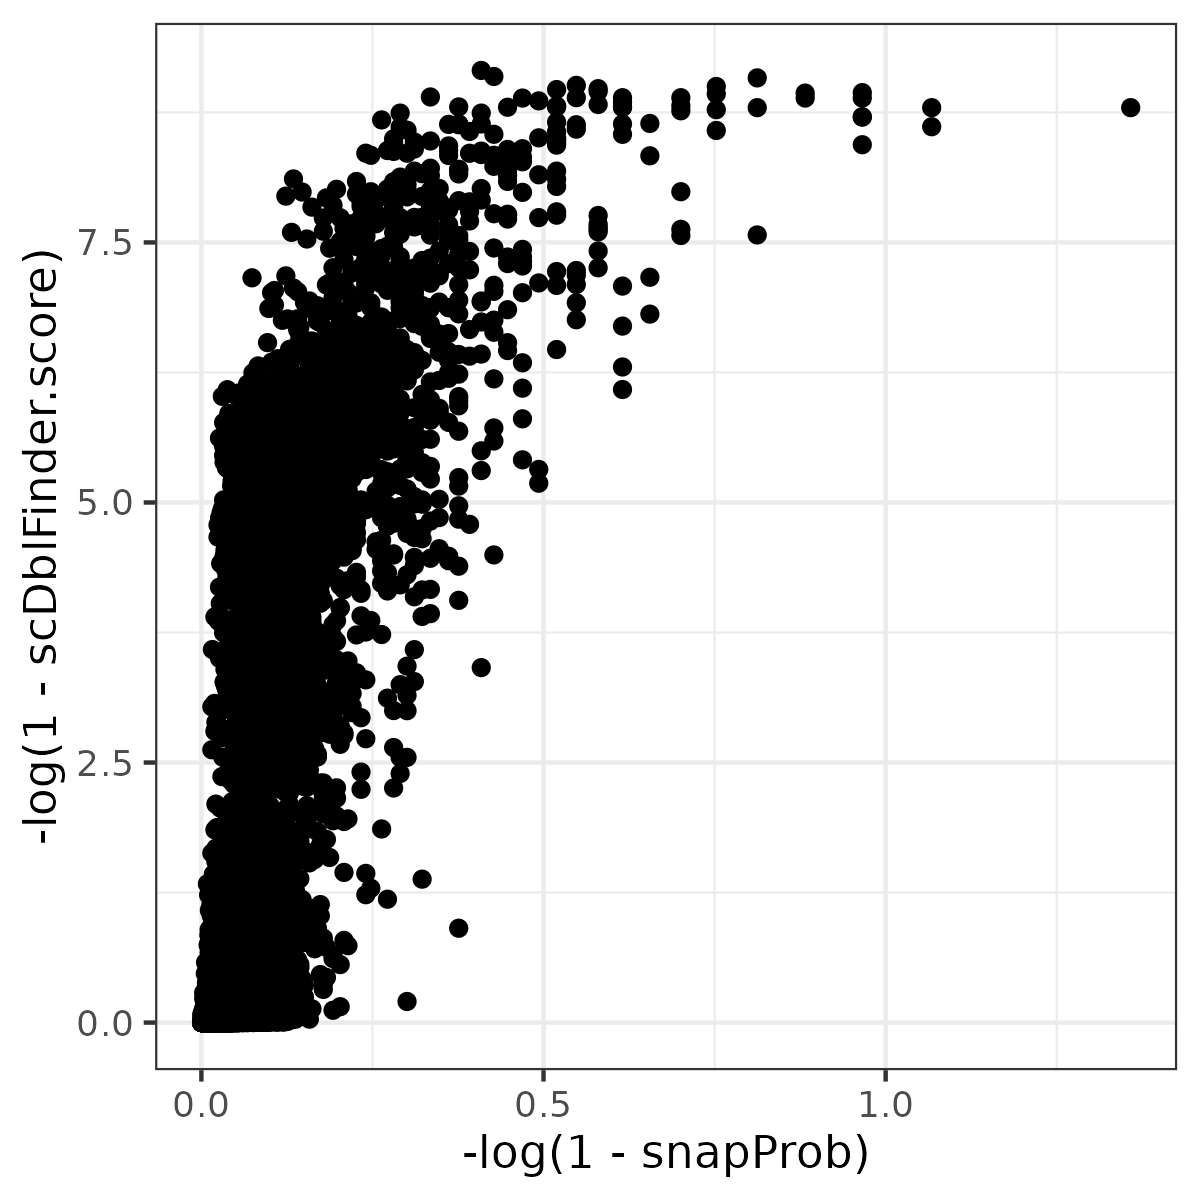
Actually, results of SnapATAC2(scrublet) and scDblFinder are similar. If you perfer strict quality control, you can use scDblFinder; else, you can use SnapATAC2.
Take home message
- Kmeans are good strategy to filter low quality cells.
- Better not use cellranger filtered methods.
- Do not use ArchR to detect doublets.
- Combine Amulet and scDblFinder/SnapATAC2 to detect doublets.
Enjoy Reading This Article?
Here are some more articles you might like to read next: