Introduction
With techniche like HiC, PCHiC, scATAC-seq, and other high-throughput omics techniques, we are able to predict the interactions between genes and enhancers. The linkSet package provides classes to represent the interactions between genes and enhancers, and provides functions to analyze and visualize the interactions.
Application Situation
linkSet can seamlessly apply to the following situation: 1. Capture HiC workflow. 2. Using HiC to identify gene-enhancer interactions. 3. Using scRNA and scATAC to predict gene-enhancer interactions.
The linkSet class
The linkSet class is a specialized data structure designed to represent and analyze genomic interactions, particularly focusing on gene-enhancer relationships. It’s part of the linkSet package, which provides tools for managing and analyzing genomic link data in bioinformatics and genomic research.
Key features of the linkSet class:
- Representation of genomic interactions:
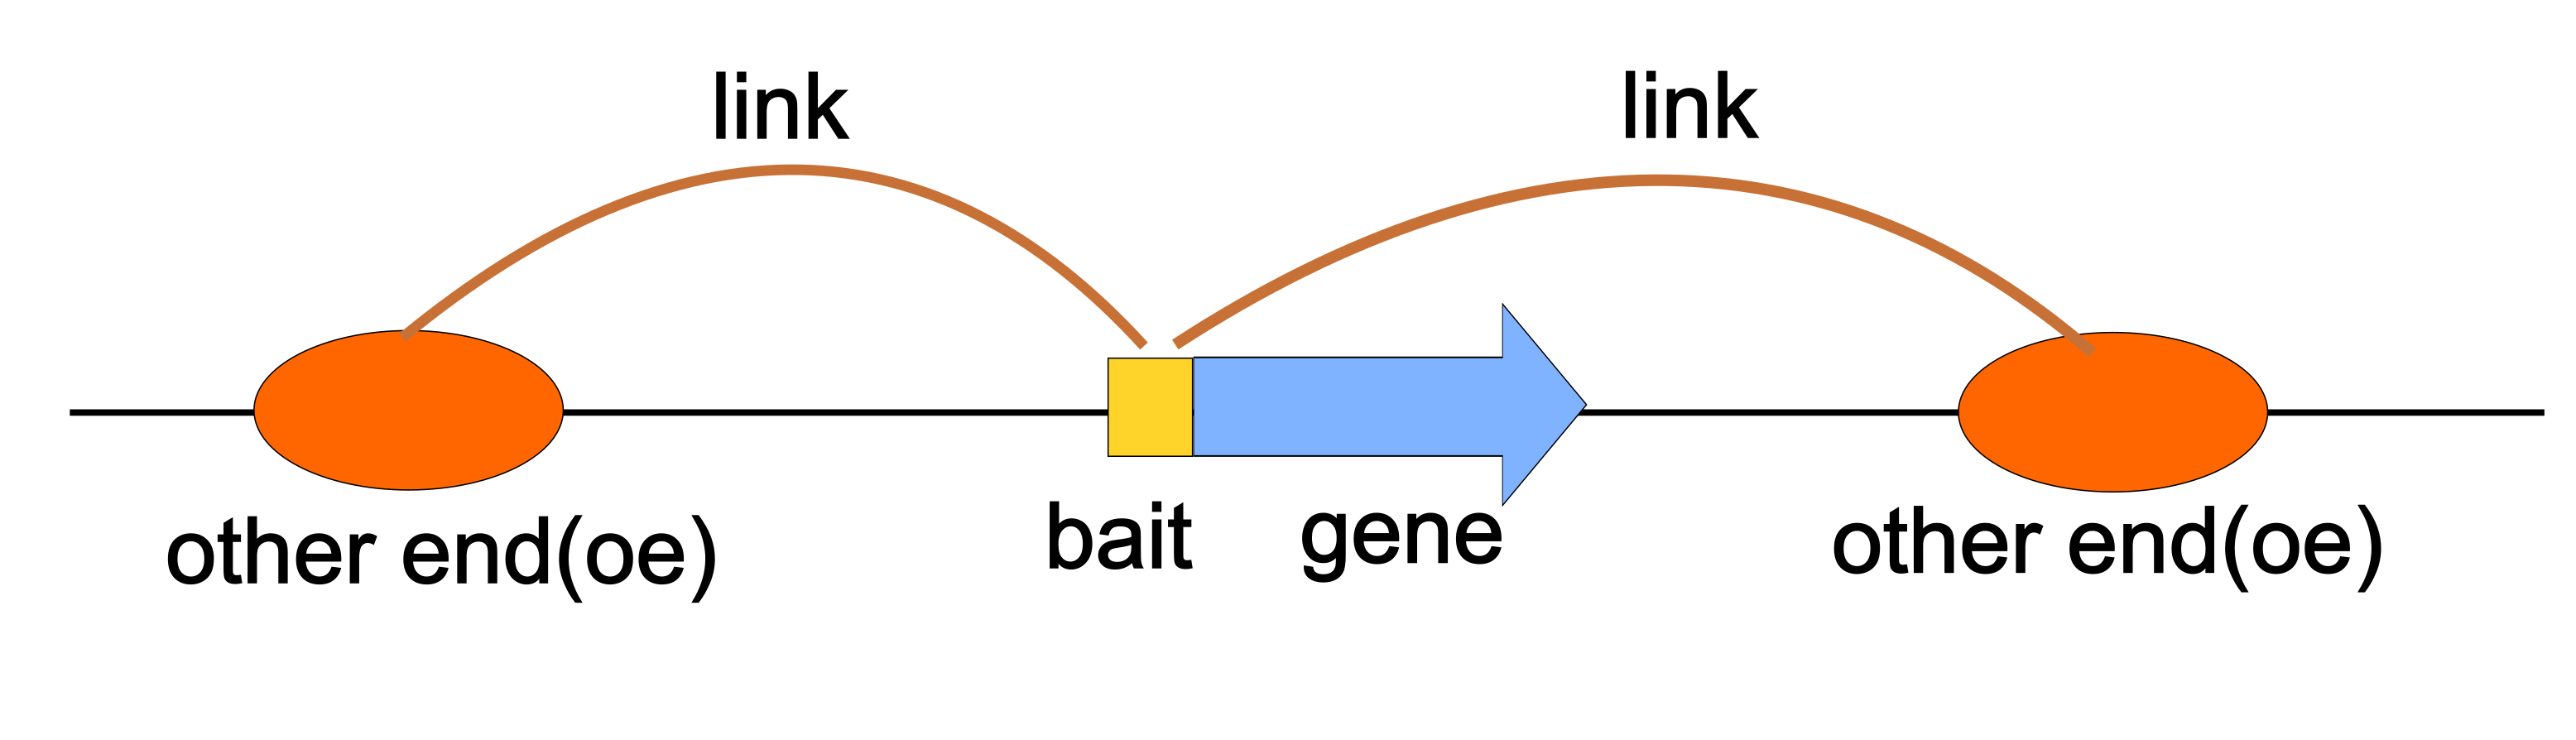
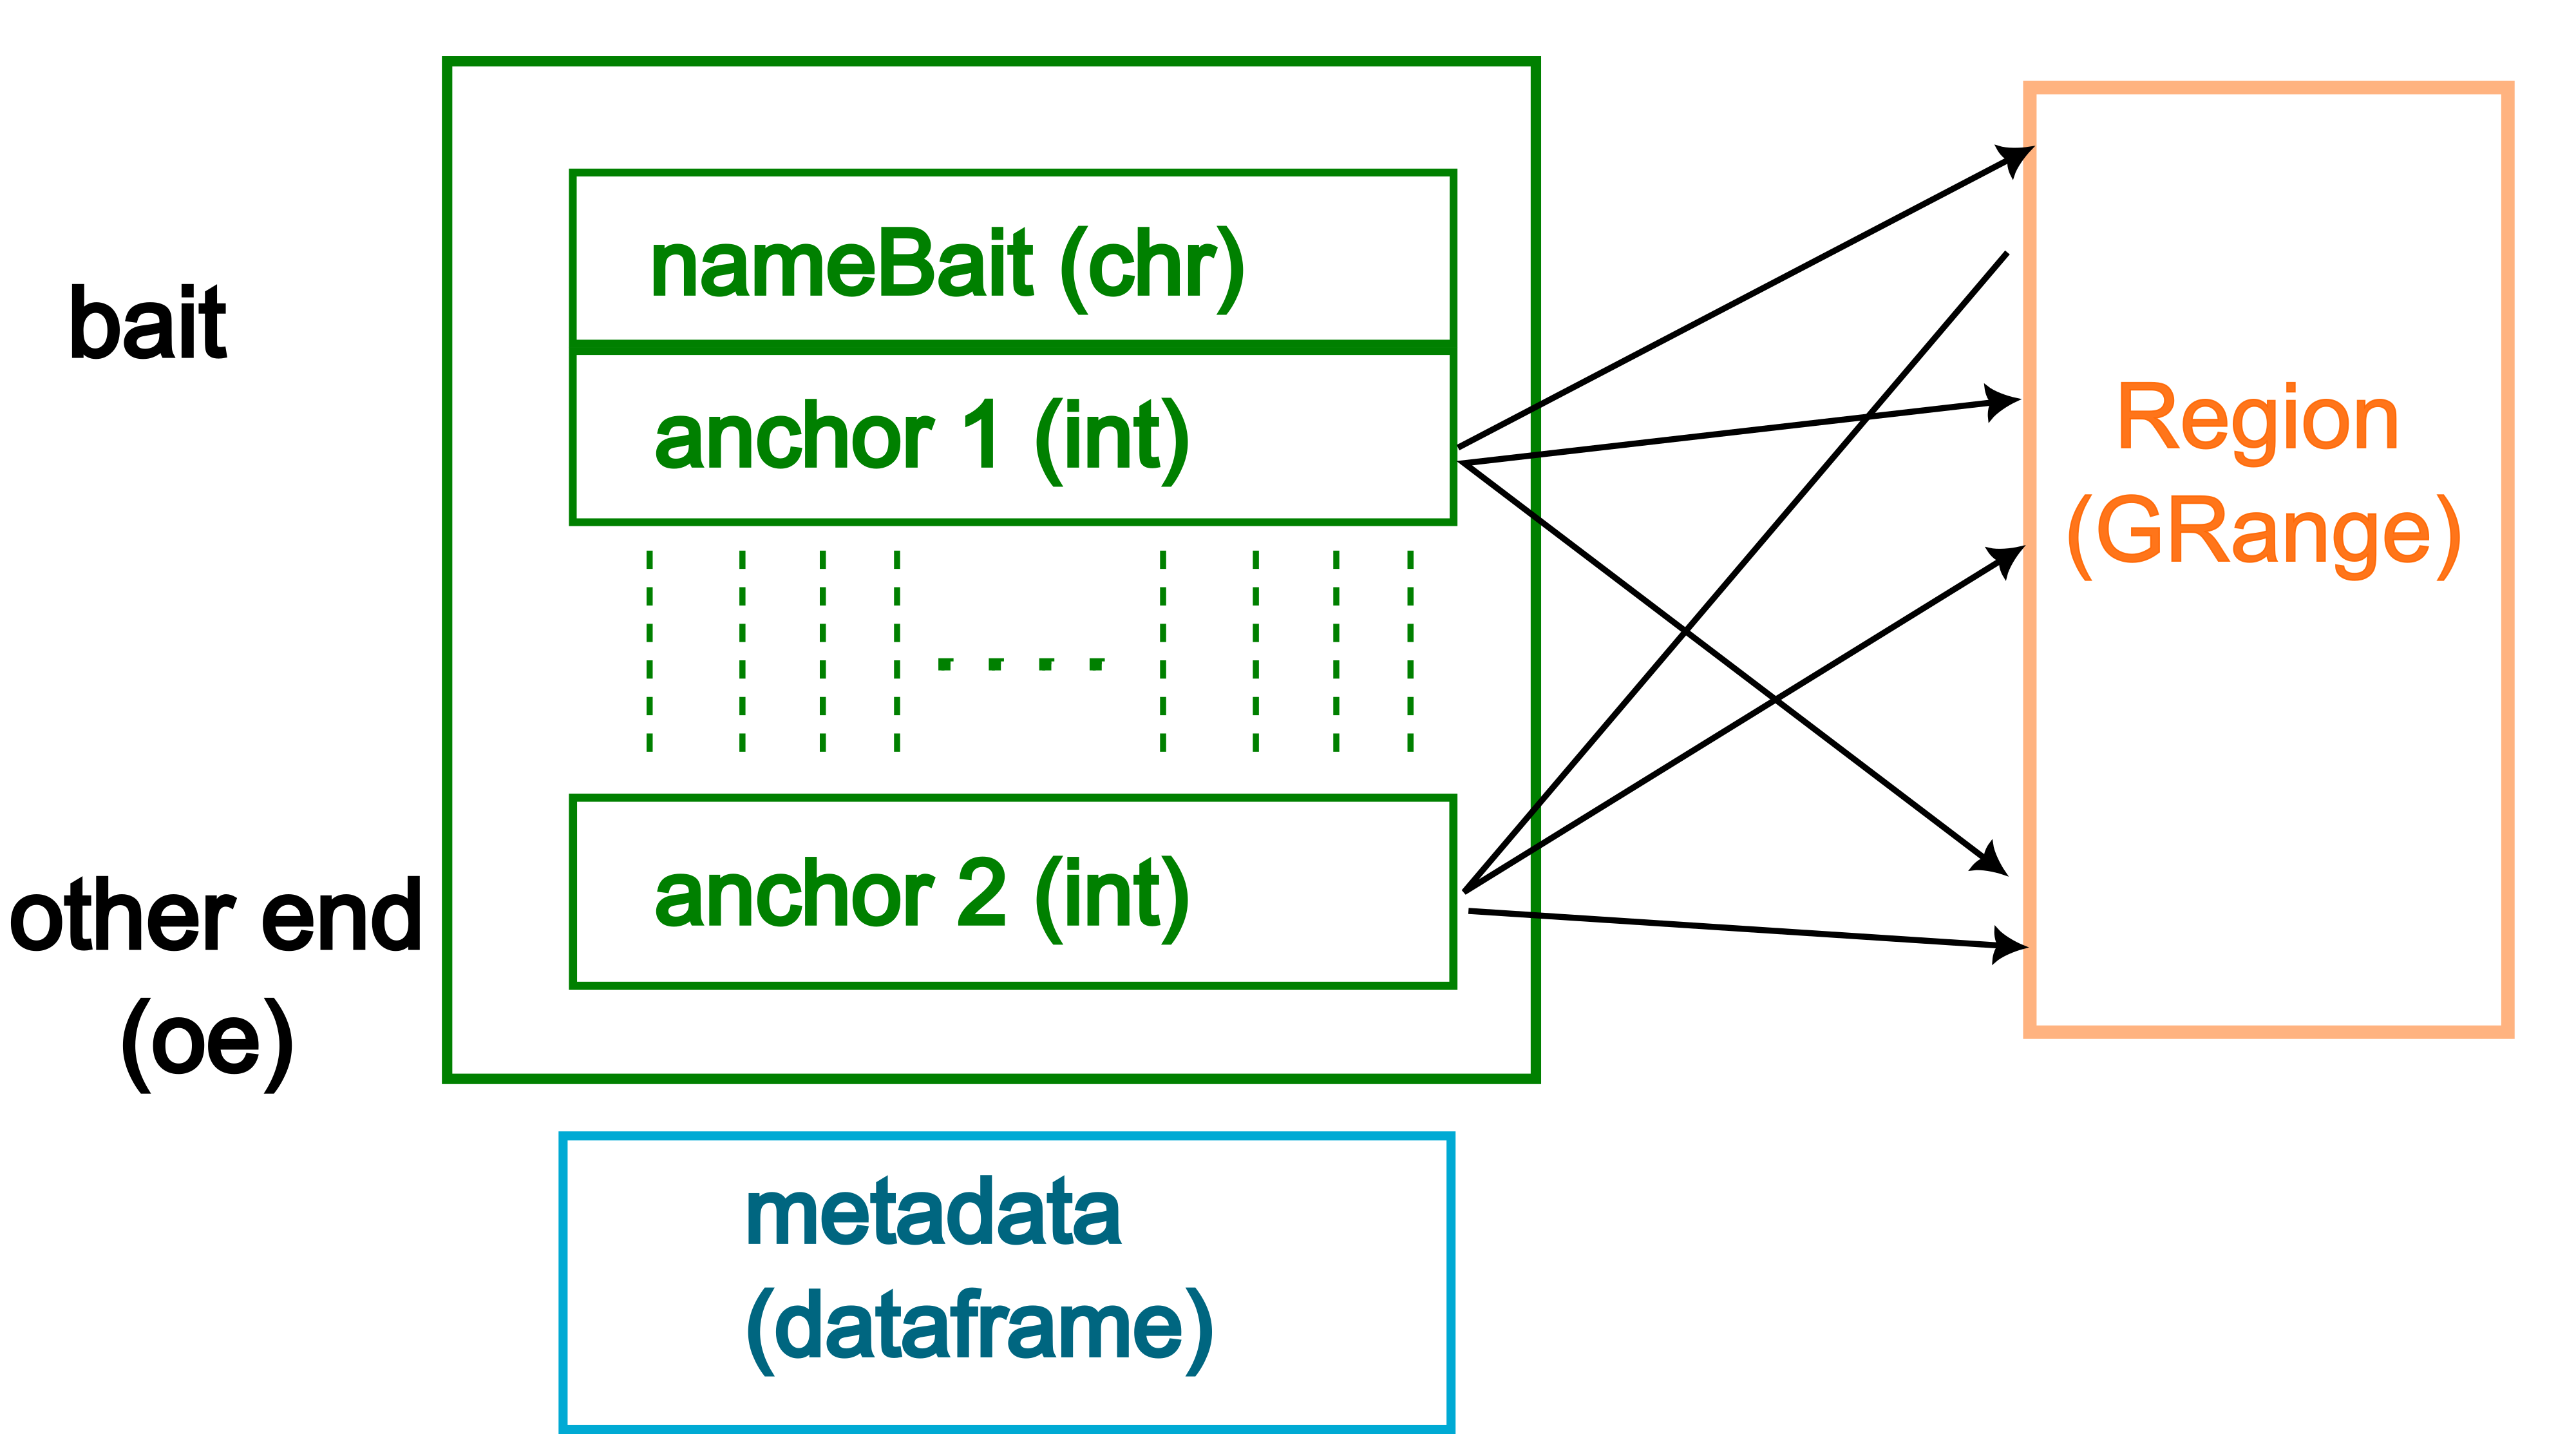
- It stores two types of genomic anchors: “bait” (typically genes) and “other end” (oe, typically enhancers or other regulatory elements).
- These anchors are represented as genomic ranges, allowing for precise localization on chromosomes.
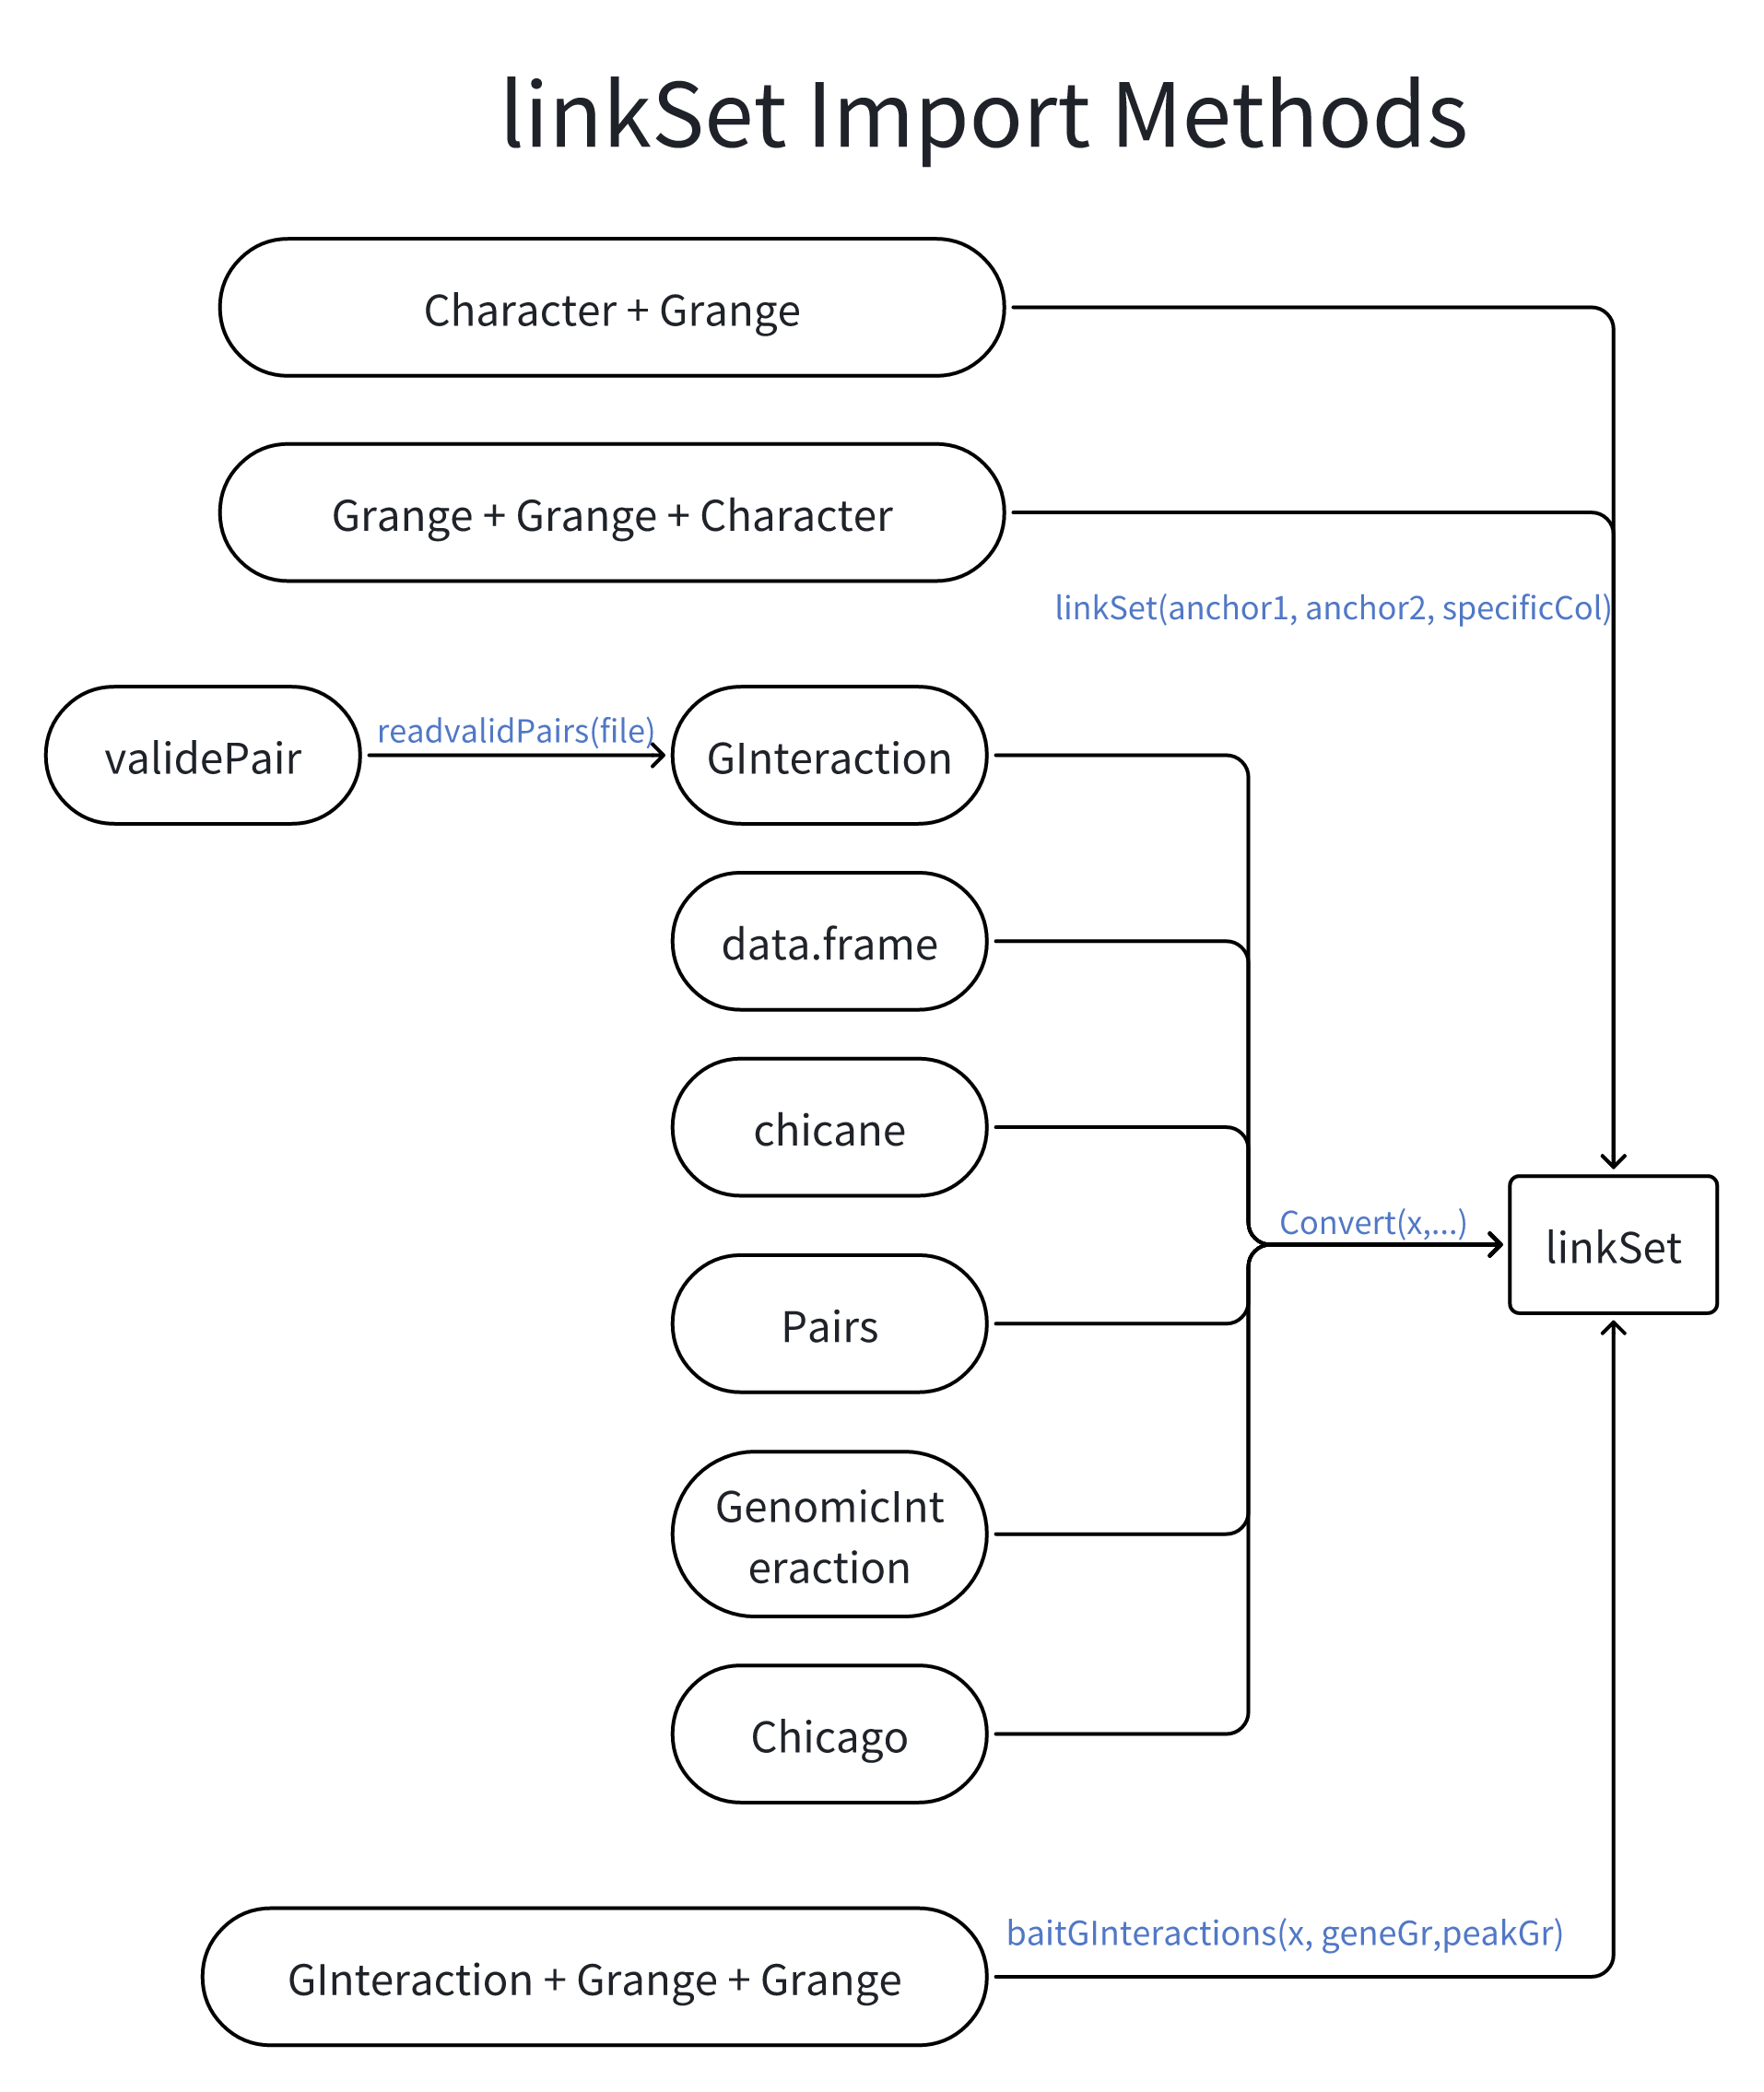
- Flexible input: Can be constructed from various data types, including GRanges objects for both anchors, or character vectors for bait and GRanges for other ends. Supports conversion from other common genomic data structures like GInteractions and data frames.
- Metadata storage: Allows for additional information to be stored alongside the genomic interactions, such as interaction scores or experimental conditions.
- Biological context: Designed to work with data from various high-throughput genomic techniques like Hi-C, Promoter Capture Hi-C (PCHi-C), and scATAC-seq. Facilitates the analysis of long-range chromatin interactions, which are crucial for understanding gene regulation and 3D genome organization.
- Annotation capabilities: Includes methods for annotating promoters and distinguishing between inter- and intra-chromosomal interactions. This feature is particularly useful for identifying potential regulatory relationships between distal genomic elements.
- Integration with Bioconductor: Built on top of established Bioconductor classes, ensuring compatibility with a wide range of genomic analysis tools.
- Visualization and analysis: The class is designed to support functions for analyzing and visualizing genomic interactions.
Construction
The linkSet class can be constructed from various data types,
including GRanges objects for both anchors, or character vectors for
bait and GRanges for other ends.
Construction from GRanges objects
To construct a linkSet object from GRanges objects:
if (!require("BiocManager", quietly = TRUE))
    install.packages("BiocManager")
library(GenomicRanges)
gr1 <- GRanges(seqnames = c("chr1", "chr1", "chr2"),
              ranges = IRanges(start = c(1, 100, 200), width = 10),
              strand = "+", symbol = c("Gene1", "Gene2", "Gene3"))
gr2 <- GRanges(seqnames = c("chr1", "chr2", "chr2"),
              ranges = IRanges(start = c(50, 150, 250), width = 10),
              strand = "+")
## construct linkSet
ls <- linkSet(gr1, gr2, specificCol = "symbol")
ls
#> linkSet object with 3 interactions and 1 metadata column:
#>              bait     seqnames_oe ranges_oe | anchor1.symbol
#>       <character>           <Rle> <IRanges> |    <character>
#>   [1]       Gene1 ---        chr1     50-59 |          Gene1
#>   [2]       Gene2 ---        chr2   150-159 |          Gene2
#>   [3]       Gene3 ---        chr2   250-259 |          Gene3
#>   -------
#>   regions: 6 ranges and 0 metadata columns
#>   seqinfo: 2 sequences from an unspecified genome; no seqlengths
Construction from GInteractions
You can also create a linkSet object from a
GInteractions object using the Convert
function:
library(InteractionSet)
#> Loading required package: SummarizedExperiment
#> Loading required package: MatrixGenerics
#> Loading required package: matrixStats
#>
#> Attaching package: 'MatrixGenerics'
#> The following objects are masked from 'package:matrixStats':
#>
#>     colAlls, colAnyNAs, colAnys, colAvgsPerRowSet, colCollapse,
#>     colCounts, colCummaxs, colCummins, colCumprods, colCumsums,
#>     colDiffs, colIQRDiffs, colIQRs, colLogSumExps, colMadDiffs,
#>     colMads, colMaxs, colMeans2, colMedians, colMins, colOrderStats,
#>     colProds, colQuantiles, colRanges, colRanks, colSdDiffs, colSds,
#>     colSums2, colTabulates, colVarDiffs, colVars, colWeightedMads,
#>     colWeightedMeans, colWeightedMedians, colWeightedSds,
#>     colWeightedVars, rowAlls, rowAnyNAs, rowAnys, rowAvgsPerColSet,
#>     rowCollapse, rowCounts, rowCummaxs, rowCummins, rowCumprods,
#>     rowCumsums, rowDiffs, rowIQRDiffs, rowIQRs, rowLogSumExps,
#>     rowMadDiffs, rowMads, rowMaxs, rowMeans2, rowMedians, rowMins,
#>     rowOrderStats, rowProds, rowQuantiles, rowRanges, rowRanks,
#>     rowSdDiffs, rowSds, rowSums2, rowTabulates, rowVarDiffs, rowVars,
#>     rowWeightedMads, rowWeightedMeans, rowWeightedMedians,
#>     rowWeightedSds, rowWeightedVars
#> Loading required package: Biobase
#> Welcome to Bioconductor
#>
#>     Vignettes contain introductory material; view with
#>     'browseVignettes()'. To cite Bioconductor, see
#>     'citation("Biobase")', and for packages 'citation("pkgname")'.
#>
#> Attaching package: 'Biobase'
#> The following object is masked from 'package:MatrixGenerics':
#>
#>     rowMedians
#> The following objects are masked from 'package:matrixStats':
#>
#>     anyMissing, rowMedians
#>
#> Attaching package: 'InteractionSet'
#> The following objects are masked from 'package:linkSet':
#>
#>     anchorIds, anchors, pairdist, reduceRegions, regions, regions<-
gi <- GInteractions(
  anchor1 = c(1, 3, 5),
  anchor2 = c(2, 4, 6),
  regions = GRanges(
    seqnames = c("chr1", "chr1", "chr2", "chr2", "chr3", "chr3"),
    ranges = IRanges(start = c(1, 50, 100, 150, 200, 250), width = 10)
    )
  )
mcols(gi)$score <- c(0.1, 0.2, 0.3)
mcols(gi)$gene <- c("Sox2", "Sox9", "Sox10")
##Convert to linkSet
ls_from_gi <- Convert(gi, baitCol = "gene")
ls_from_gi
#> linkSet object with 3 interactions and 2 metadata columns:
#>              bait     seqnames_oe ranges_oe |     score        gene
#>       <character>           <Rle> <IRanges> | <numeric> <character>
#>   [1]        Sox2 ---        chr1     50-59 |       0.1        Sox2
#>   [2]        Sox9 ---        chr2   150-159 |       0.2        Sox9
#>   [3]       Sox10 ---        chr3   250-259 |       0.3       Sox10
#>   -------
#>   regions: 6 ranges and 0 metadata columns
#>   seqinfo: 3 sequences from an unspecified genome; no seqlengths
Some times, you need to use gene and enhancer information to
construct a linkSet object from GInteractions.
geneGr <- GRanges(
  seqnames = c("chr1", "chr2", "chr3"),
  ranges = IRanges(start = c(5, 105, 205), width = 20),
  symbol = c("Gene1", "Gene2", "Gene3")
)

peakGr <- GRanges(
  seqnames = c("chr1", "chr2", "chr3"),
  ranges = IRanges(start = c(45, 145, 245), width = 10)
)

# Run baitGInteractions
ls_from_gi_2 <- baitGInteractions(gi, geneGr, peakGr, geneSymbol = "symbol")

ls_from_gi_2
#> linkSet object with 3 interactions and 3 metadata columns:
#>              bait     seqnames_oe ranges_oe | anchor1.symbol     score
#>       <character>           <Rle> <IRanges> |    <character> <numeric>
#>   [1]       Gene1 ---        chr1     45-54 |          Gene1       0.1
#>   [2]       Gene2 ---        chr2   145-154 |          Gene2       0.2
#>   [3]       Gene3 ---        chr3   245-254 |          Gene3       0.3
#>              gene
#>       <character>
#>   [1]        Sox2
#>   [2]        Sox9
#>   [3]       Sox10
#>   -------
#>   regions: 6 ranges and 0 metadata columns
#>   seqinfo: 3 sequences from an unspecified genome; no seqlengths
Other construction methods
You can also construct a linkSet object from a data
frame.
test_df <- data.frame(
  gene = c("gene1", "gene2", "gene3"),
  peak = c("chr1:1000-2000", "chr2:3000-4000", "chr3:5000-6000"),
  score = c(0.5, 0.7, 0.9),
  stringsAsFactors = FALSE
)

# Test successful conversion
ls_from_df <- Convert(test_df)
ls_from_df
#> linkSet object with 3 interactions and 1 metadata column:
#>              bait     seqnames_oe ranges_oe |     score
#>       <character>           <Rle> <IRanges> | <numeric>
#>   [1]       gene1 ---        chr1 1000-2000 |       0.5
#>   [2]       gene2 ---        chr2 3000-4000 |       0.7
#>   [3]       gene3 ---        chr3 5000-6000 |       0.9
#>   -------
#>   regions: 3 ranges and 0 metadata columns
#>   seqinfo: 3 sequences from an unspecified genome; no seqlengths
Accessors
Getters
The important elements of the linkSet object can be
easily accessed by the following accessors:
-
regions(x): Get the regions of thelinkSetobject. -
bait(x): Get the bait of thelinkSetobject. -
oe(x): Get the other end of thelinkSetobject. -
regionsBait(x): Get the bait regions of thelinkSetobject. -
regionsOe(x): Get the other end regions of thelinkSetobject. -
mcols(x): Get the metadata of thelinkSetobject.
linkSet::regions(ls)
#> GRanges object with 6 ranges and 0 metadata columns:
#>       seqnames    ranges strand
#>          <Rle> <IRanges>  <Rle>
#>   [1]     chr1      1-10      +
#>   [2]     chr1     50-59      +
#>   [3]     chr1   100-109      +
#>   [4]     chr2   150-159      +
#>   [5]     chr2   200-209      +
#>   [6]     chr2   250-259      +
#>   -------
#>   seqinfo: 2 sequences from an unspecified genome; no seqlengths
regionsBait(ls)
#> GRanges object with 3 ranges and 0 metadata columns:
#>       seqnames    ranges strand
#>          <Rle> <IRanges>  <Rle>
#>   [1]     chr1      1-10      +
#>   [2]     chr1   100-109      +
#>   [3]     chr2   200-209      +
#>   -------
#>   seqinfo: 2 sequences from an unspecified genome; no seqlengths
oe(ls)
#> GRanges object with 3 ranges and 0 metadata columns:
#>       seqnames    ranges strand
#>          <Rle> <IRanges>  <Rle>
#>   [1]     chr1     50-59      +
#>   [2]     chr2   150-159      +
#>   [3]     chr2   250-259      +
#>   -------
#>   seqinfo: 2 sequences from an unspecified genome; no seqlengths
bait(ls)
#> [1] "Gene1" "Gene2" "Gene3"
mcols(ls)
#> DataFrame with 3 rows and 1 column
#>   anchor1.symbol
#>      <character>
#> 1          Gene1
#> 2          Gene2
#> 3          Gene3
Setters
Wait… You set wrong bait or oe region? You can also change it easily:
new_bait <- c("Gene40","Gene41","Gene42")
new_oe <- GRanges(
  seqnames = c("chr1", "chr2", "chr3"),
  ranges = IRanges(start = c(5, 105, 205), width = 20),
  symbol = c("Gene1", "Gene2", "Gene3")
)
bait(ls) <- new_bait
oe(ls) <- new_oe
ls
#> linkSet object with 3 interactions and 2 metadata columns:
#>              bait     seqnames_oe ranges_oe | anchor1.symbol      symbol
#>       <character>           <Rle> <IRanges> |    <character> <character>
#>   [1]      Gene40 ---        chr1      5-24 |          Gene1       Gene1
#>   [2]      Gene41 ---        chr2   105-124 |          Gene2       Gene2
#>   [3]      Gene42 ---        chr3   205-224 |          Gene3       Gene3
#>   -------
#>   regions: 6 ranges and 0 metadata columns
#>   seqinfo: 3 sequences from an unspecified genome; no seqlengths
Subsetting and concatenation
LinkSet object can be easily subsetted by index.
ls_sub <- ls[1:2]
ls_sub
#> linkSet object with 2 interactions and 2 metadata columns:
#>              bait     seqnames_oe ranges_oe | anchor1.symbol      symbol
#>       <character>           <Rle> <IRanges> |    <character> <character>
#>   [1]      Gene40 ---        chr1      5-24 |          Gene1       Gene1
#>   [2]      Gene41 ---        chr2   105-124 |          Gene2       Gene2
#>   -------
#>   regions: 6 ranges and 0 metadata columns
#>   seqinfo: 3 sequences from an unspecified genome; no seqlengths
If you are interested in a specific gene or region, you can subset
the linkSet object by the bait or oe region.
ls_sub_2 <- subsetBait(ls, "Gene1")
ls_sub_2
#> linkSet object with 0 interactions and 2 metadata columns:
#>           bait     seqnames_oe ranges_oe | anchor1.symbol      symbol
#>    <character>           <Rle> <IRanges> |    <character> <character>
#>   -------
#>   regions: 0 ranges and 0 metadata columns
#>   seqinfo: 3 sequences from an unspecified genome; no seqlengths
ls_sub_3 <- subsetBaitRegion(ls, "chr1:100-200")
ls_sub_3
#> linkSet object with 1 interaction and 2 metadata columns:
#>              bait     seqnames_oe ranges_oe | anchor1.symbol      symbol
#>       <character>           <Rle> <IRanges> |    <character> <character>
#>   [1]      Gene41 ---        chr2   105-124 |          Gene2       Gene2
#>   -------
#>   regions: 2 ranges and 0 metadata columns
#>   seqinfo: 3 sequences from an unspecified genome; no seqlengths
You can also concatenate two linkSet objects.
ls_concat <- c(ls, ls)
ls_concat
#> linkSet object with 6 interactions and 2 metadata columns:
#>              bait     seqnames_oe ranges_oe | anchor1.symbol      symbol
#>       <character>           <Rle> <IRanges> |    <character> <character>
#>   [1]      Gene40 ---        chr1      5-24 |          Gene1       Gene1
#>   [2]      Gene41 ---        chr2   105-124 |          Gene2       Gene2
#>   [3]      Gene42 ---        chr3   205-224 |          Gene3       Gene3
#>   [4]      Gene40 ---        chr1      5-24 |          Gene1       Gene1
#>   [5]      Gene41 ---        chr2   105-124 |          Gene2       Gene2
#>   [6]      Gene42 ---        chr3   205-224 |          Gene3       Gene3
#>   -------
#>   regions: 6 ranges and 0 metadata columns
#>   seqinfo: 3 sequences from an unspecified genome; no seqlengths
GRanges method
The features of linkSet is inherited from GRanges, which means you can use all the functions in GRanges to manipulate the linkSet object. The most wonderful things is that you can change the bait region and oe region separately.
data(linkExample)
linkExample
#> linkSet object with 5 interactions and 1 metadata column:
#>              bait     seqnames_oe ranges_oe | anchor1.symbol
#>       <character>           <Rle> <IRanges> |    <character>
#>   [1]       Gene1 ---        chr1     50-59 |          Gene1
#>   [2]       Gene1 ---        chr2   150-159 |          Gene1
#>   [3]       Gene2 ---        chr2   250-259 |          Gene2
#>   [4]       Gene3 ---        chr4   350-359 |          Gene3
#>   [5]       Gene3 ---        chr4   450-459 |          Gene3
#>   -------
#>   regions: 10 ranges and 0 metadata columns
#>   seqinfo: 4 sequences from an unspecified genome; no seqlengths

## resize the bait region
resize_bait <- resizeRegions(linkExample, width = 75, fix = "start", region = "bait")
resize_bait
#> linkSet object with 5 interactions and 1 metadata column:
#>              bait     seqnames_oe ranges_oe | anchor1.symbol
#>       <character>           <Rle> <IRanges> |    <character>
#>   [1]       Gene1 ---        chr1     50-59 |          Gene1
#>   [2]       Gene1 ---        chr2   150-159 |          Gene1
#>   [3]       Gene2 ---        chr2   250-259 |          Gene2
#>   [4]       Gene3 ---        chr4   350-359 |          Gene3
#>   [5]       Gene3 ---        chr4   450-459 |          Gene3
#>   -------
#>   regions: 10 ranges and 0 metadata columns
#>   seqinfo: 4 sequences from an unspecified genome; no seqlengths

## resize the oe region
resize_oe <- resizeRegions(linkExample, width = 75, fix = "start", region = "oe")
resize_oe
#> linkSet object with 5 interactions and 1 metadata column:
#>              bait     seqnames_oe ranges_oe | anchor1.symbol
#>       <character>           <Rle> <IRanges> |    <character>
#>   [1]       Gene1 ---        chr1    50-124 |          Gene1
#>   [2]       Gene1 ---        chr2   150-224 |          Gene1
#>   [3]       Gene2 ---        chr2   250-324 |          Gene2
#>   [4]       Gene3 ---        chr4   350-424 |          Gene3
#>   [5]       Gene3 ---        chr4   450-524 |          Gene3
#>   -------
#>   regions: 10 ranges and 0 metadata columns
#>   seqinfo: 4 sequences from an unspecified genome; no seqlengths
The reduce method allows the linkSet
objects to be collapsed across the whole of the linkSet
object.
reduce_ls <- reduce(ls_concat)
reduce_ls
#> linkSet object with 3 interactions and 3 metadata columns:
#>              bait     seqnames_oe ranges_oe | anchor1.symbol      symbol
#>       <character>           <Rle> <IRanges> |    <character> <character>
#>   [1]      Gene40 ---        chr1      5-24 |          Gene1       Gene1
#>   [2]      Gene41 ---        chr2   105-124 |          Gene2       Gene2
#>   [3]      Gene42 ---        chr3   205-224 |          Gene3       Gene3
#>           count
#>       <integer>
#>   [1]         2
#>   [2]         2
#>   [3]         2
#>   -------
#>   regions: 6 ranges and 0 metadata columns
#>   seqinfo: 3 sequences from an unspecified genome; no seqlengths
By default, we will collapse the duplicate interactions, and count
the interactions and store in the metadata columns. You can also choose
not to count the interactions by set
countInteractions = FALSE.
reduce_ls_2 <- linkSet::reduceRegions(ls_concat, countInteractions = FALSE)
reduce_ls_2
#> linkSet object with 6 interactions and 2 metadata columns:
#>              bait     seqnames_oe ranges_oe | anchor1.symbol      symbol
#>       <character>           <Rle> <IRanges> |    <character> <character>
#>   [1]      Gene40 ---        chr1      5-24 |          Gene1       Gene1
#>   [2]      Gene41 ---        chr2   105-124 |          Gene2       Gene2
#>   [3]      Gene42 ---        chr3   205-224 |          Gene3       Gene3
#>   [4]      Gene40 ---        chr1      5-24 |          Gene1       Gene1
#>   [5]      Gene41 ---        chr2   105-124 |          Gene2       Gene2
#>   [6]      Gene42 ---        chr3   205-224 |          Gene3       Gene3
#>   -------
#>   regions: 6 ranges and 0 metadata columns
#>   seqinfo: 3 sequences from an unspecified genome; no seqlengths
Diagnose
There are two metrics to diagnose the quality of the
linkSet object: 1. The intra/inter-chromosomal
interactions. 2. The distance between the bait and oe region.
The diagnose function can help you to diagnose the
linkSet object.
diagnoseLinkSet(linkExample)
#> `stat_bin()` using `bins = 30`. Pick better value with `binwidth`.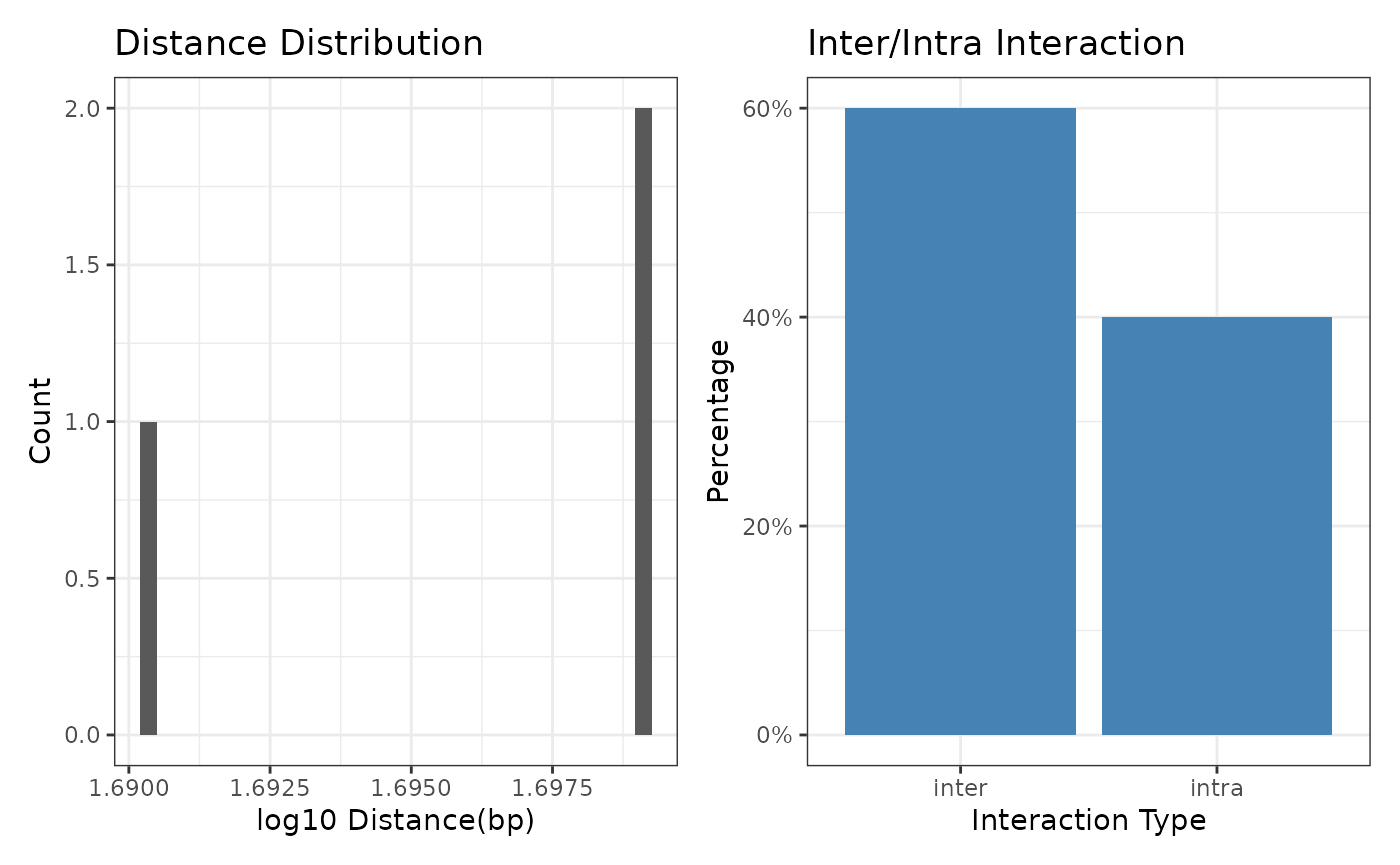
#> linkSet object with 5 interactions and 3 metadata columns:
#>              bait     seqnames_oe ranges_oe | anchor1.symbol  inter_type
#>       <character>           <Rle> <IRanges> |    <character> <character>
#>   [1]       Gene1 ---        chr1     50-59 |          Gene1       inter
#>   [2]       Gene1 ---        chr2   150-159 |          Gene1       intra
#>   [3]       Gene2 ---        chr2   250-259 |          Gene2       inter
#>   [4]       Gene3 ---        chr4   350-359 |          Gene3       intra
#>   [5]       Gene3 ---        chr4   450-459 |          Gene3       inter
#>        distance
#>       <integer>
#>   [1]        49
#>   [2]      <NA>
#>   [3]        50
#>   [4]      <NA>
#>   [5]        50
#>   -------
#>   regions: 10 ranges and 0 metadata columns
#>   seqinfo: 4 sequences from an unspecified genome; no seqlengths
ls_concat
#> linkSet object with 6 interactions and 2 metadata columns:
#>              bait     seqnames_oe ranges_oe | anchor1.symbol      symbol
#>       <character>           <Rle> <IRanges> |    <character> <character>
#>   [1]      Gene40 ---        chr1      5-24 |          Gene1       Gene1
#>   [2]      Gene41 ---        chr2   105-124 |          Gene2       Gene2
#>   [3]      Gene42 ---        chr3   205-224 |          Gene3       Gene3
#>   [4]      Gene40 ---        chr1      5-24 |          Gene1       Gene1
#>   [5]      Gene41 ---        chr2   105-124 |          Gene2       Gene2
#>   [6]      Gene42 ---        chr3   205-224 |          Gene3       Gene3
#>   -------
#>   regions: 6 ranges and 0 metadata columns
#>   seqinfo: 3 sequences from an unspecified genome; no seqlengths
The annotated distance and interaction type is shown in the
distance and inter_type column.
You can remove the intrachromosomal interactions by:
ls_concat <- filterLinks(ls_concat, filter_intra = TRUE)
ls_concat
#> linkSet object with 2 interactions and 4 metadata columns:
#>              bait     seqnames_oe ranges_oe | anchor1.symbol      symbol
#>       <character>           <Rle> <IRanges> |    <character> <character>
#>   [1]      Gene40 ---        chr1      5-24 |          Gene1       Gene1
#>   [2]      Gene40 ---        chr1      5-24 |          Gene1       Gene1
#>        inter_type  distance
#>       <character> <integer>
#>   [1]       inter         9
#>   [2]       inter         9
#>   -------
#>   regions: 2 ranges and 0 metadata columns
#>   seqinfo: 3 sequences from an unspecified genome; no seqlengths
Annotations
It might be common that you only have the bait name, but don’t have the exact bait region. The annotation function can help you to annotate the bait region from a gene annotation.
gr1 <- GRanges(seqnames = c("chr1", "chr3", "chr3"),
               ranges = IRanges(start = c(1000, 2000, 3000), width = 100),
               strand = "+", symbol = c("BRCA1", "TP53", "NONEXISTENT"))
gr2 <- GRanges(seqnames = c("chr1", "chr2", "chr3"),
               ranges = IRanges(start = c(5000, 6000, 7000), width = 100),
               strand = "+")
ls <- linkSet(gr1, gr2, specificCol = "symbol")

# Test annotatePromoter
annotated_ls <- suppressWarnings(annotatePromoter(ls, genome = "hg38", upstream = 500,overwrite = T))
#>
annotated_ls
#> linkSet object with 3 interactions and 1 metadata column:
#>              bait     seqnames_oe ranges_oe | anchor1.symbol
#>       <character>           <Rle> <IRanges> |    <character>
#>   [1]       BRCA1 ---        chr1 5000-5099 |          BRCA1
#>   [2]        TP53 ---        chr2 6000-6099 |           TP53
#>   [3] NONEXISTENT ---        chr3 7000-7099 |    NONEXISTENT
#>   -------
#>   regions: 6 ranges and 0 metadata columns
#>   seqinfo: 712 sequences (1 circular) from 2 genomes (hg38, NA)
Statistical analysis
Functional enhancers usually regulate multiple genes, we can use cross gene analysis to identify the cross gene enhancers.
annotated_ls <- crossGeneEnhancer(annotated_ls)
annotated_ls <- orderLinks(annotated_ls,by = "crossFreq",decreasing = TRUE)
annotated_ls
#> linkSet object with 3 interactions and 2 metadata columns:
#>              bait     seqnames_oe ranges_oe | anchor1.symbol crossFreq
#>       <character>           <Rle> <IRanges> |    <character> <integer>
#>   [1]       BRCA1 ---        chr1 5000-5099 |          BRCA1         1
#>   [2]        TP53 ---        chr2 6000-6099 |           TP53         1
#>   [3] NONEXISTENT ---        chr3 7000-7099 |    NONEXISTENT         1
#>   -------
#>   regions: 6 ranges and 0 metadata columns
#>   seqinfo: 712 sequences (1 circular) from 2 genomes (hg38, NA)
linkSet also implement the CHiCANE
analysis, which can identifying the high-confidence interactions.
CHiCANE needs to count interactibility and dist before
running the statistical test.
annotated_ls <- countInteractibility(annotated_ls)
annotated_ls <- linkSet::pairdist(annotated_ls)
annotated_ls <- run_chicane(annotated_ls)
#> [1] "Not found column 'bait.id', adding bait name as default."
#> [1] "Not found column 'bait.to.bait' Set 'FALSE' as default."
#> [1] "fitting model...."
#>
#> Attaching package: 'data.table'
#> The following object is masked from 'package:SummarizedExperiment':
#>
#>     shift
#> The following object is masked from 'package:GenomicRanges':
#>
#>     shift
#> The following object is masked from 'package:IRanges':
#>
#>     shift
#> The following objects are masked from 'package:S4Vectors':
#>
#>     first, second
#> Warning in glm.fitter(x = X, y = Y, weights = w, start = start, etastart =
#> etastart, : no observations informative at iteration 1
#> Warning in glm.fitter(x = X, y = Y, weights = w, start = start, etastart =
#> etastart, : no observations informative at iteration 1
#> Warning: glm.fit: algorithm did not converge
annotated_ls
#> linkSet object with 3 interactions and 12 metadata columns:
#>              bait     seqnames_oe ranges_oe | anchor1.symbol crossFreq
#>       <character>           <Rle> <IRanges> |    <character> <integer>
#>   [1]       BRCA1 ---        chr1 5000-5099 |          BRCA1         1
#>   [2]        TP53 ---        chr2 6000-6099 |           TP53         1
#>   [3] NONEXISTENT ---        chr3 7000-7099 |    NONEXISTENT         1
#>        inter_type     count bait.trans.count target.trans.count  distance
#>       <character> <integer>        <numeric>          <numeric> <integer>
#>   [1]       intra         1                1                  1      <NA>
#>   [2]       intra         1                1                  1      <NA>
#>   [3]       intra         1                1                  1      <NA>
#>           bait.id bait.to.bait  expected   p.value   q.value
#>       <character>    <logical> <numeric> <numeric> <numeric>
#>   [1]       BRCA1        FALSE         1  0.632121  0.632121
#>   [2]        TP53        FALSE         1  0.632121  0.632121
#>   [3] NONEXISTENT        FALSE         1  0.632121  0.632121
#>   -------
#>   regions: 6 ranges and 0 metadata columns
#>   seqinfo: 712 sequences (1 circular) from 2 genomes (hg38, NA)
Visualization
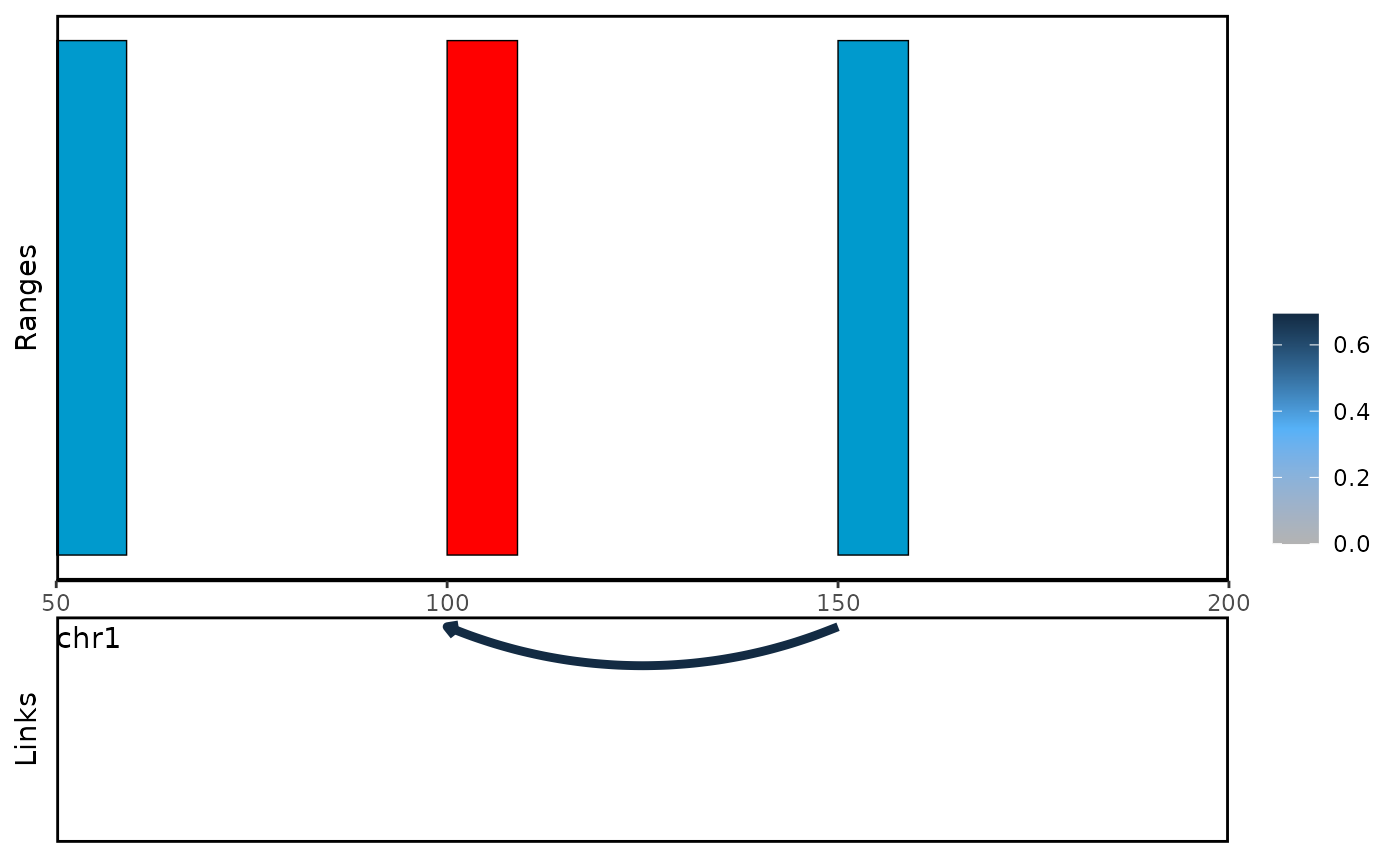
With plot_genomic_ranges function, you can visualize the
link between bait and oe region.
You can choose the oe-centric views to visualize the functional enhancer which regulate multiple genes.
plot_genomic_ranges(linkExample,extend.base = 10)
#> Warning in plot_genomic_ranges(linkExample, extend.base = 10): score.col not
#> found, using count as default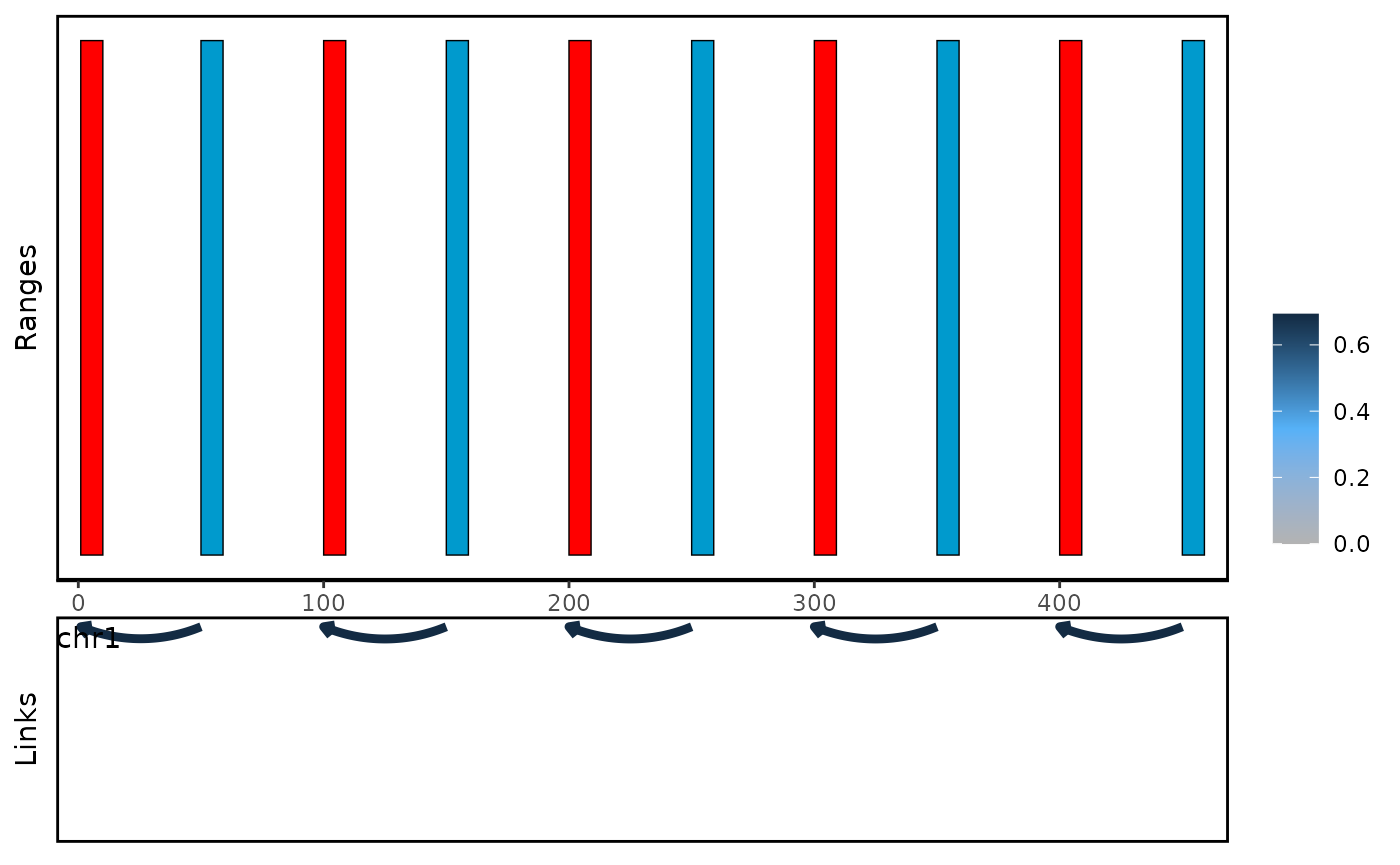
You can adjust the range of the views.
plot_genomic_ranges(linkExample,extend.base = 10,x.range = c(50,200))
#> Warning in plot_genomic_ranges(linkExample, extend.base = 10, x.range = c(50, :
#> score.col not found, using count as default